This article shows you how to clear the items WordPress Site Health marks red on a cPanel or WHM server. It is written for anyone who runs the site and can also open a shell on the server. Site Health lives at Tools → Site Health, runs a list of automated checks, and reports each one as passed, recommended or critical. Its wording is deliberately general, so one red line such as The REST API encountered an error covers a dozen different causes. The short answer is to reproduce each item with a single command first, because the command shows you the real status code and the real error text. By the end you will have the genuine failures fixed, plus a list of the items you can leave red on purpose.
What you’ll accomplish
- Reproduce any Site Health item with one command instead of guessing at it.
- Fix the REST API and loopback failures at the layer that causes them.
- Put the account on a supported PHP version with the image extensions WordPress wants.
- Move scheduled work off pseudo-cron and onto a real cron job.
- Tell genuine failures apart from the checks that are safe to leave red.
Prerequisites
- WordPress 6.0 or newer. Site Health arrived in 5.2 and its check list keeps growing, so your screen may show items this page does not.
- Shell access to the account, over SSH or cPanel’s Terminal, plus
curl. - WP-CLI, the WordPress command line tool, available as
wp. Most cPanel servers carry it, and every step below also works through cPanel and the browser. - cPanel access for MultiPHP Manager and MultiPHP INI Editor. Three fixes want WHM or root instead, and each says so.
- Knowing whether Cloudflare or another WAF sits in front of the site. WAF means web application firewall, a filter that inspects requests before they reach your server.
How it works
Site Health runs two kinds of test. Direct tests run inside the page request and read your PHP version, database version and plugin list straight away. Async tests run afterwards, from your browser, as separate REST requests back to the site. REST stands for Representational State Transfer; in WordPress it means the JSON interface under /wp-json/. That second group produces most red items, because those tests need the site to reach itself over the network.
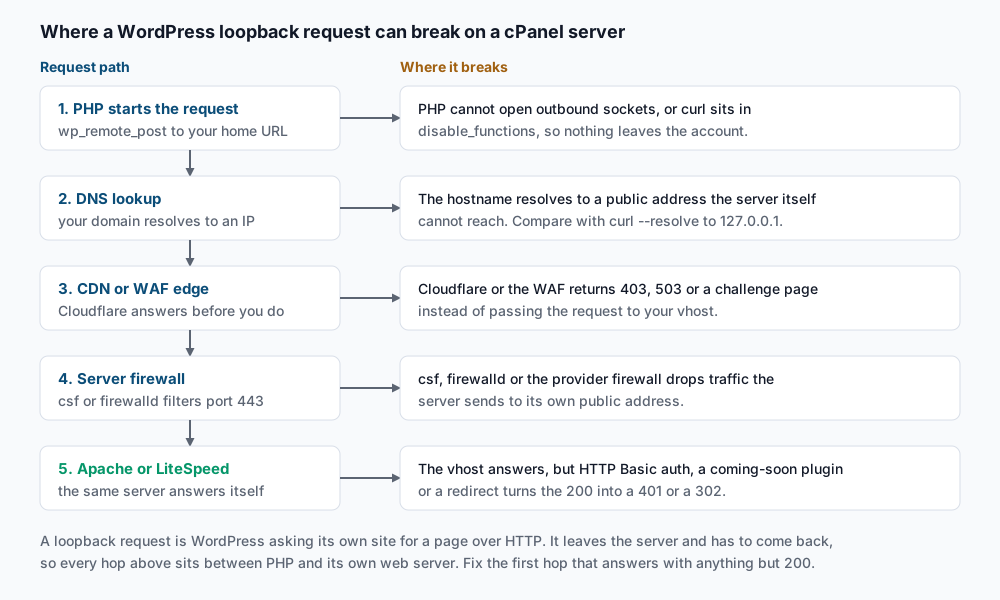
Two checks make that dependency plain. The REST API test asks for wp-json/wp/v2/types/post in edit context and wants a 200 back. The loopback test posts to wp-cron.php at your own site address and wants a 200 too. A loopback request is WordPress asking its own site for a page over HTTP, using your public hostname rather than a filesystem shortcut. It leaves the server and has to come back.
The other half of the tool is the debug information screen at Tools → Site Health → Info, which lists your server software, PHP version, loaded extensions, constants and directory sizes. Its Copy site info to clipboard button produces a plain text block for a support ticket.
WordPress core ships no wp site-health command for WP-CLI, so triage from the shell uses ordinary wp, curl, php and grep. Keep in mind that Site Health tests are pass or fail heuristics. They are rules of thumb written for an average install, and several stay red on a well-run server for good reasons.
Step-by-step
1. Confirm the two addresses WordPress uses. Every test below starts from them.
wp option get home
wp option get siteurl
https://example.com
https://example.comIf either differs from the address you type in a browser, correct that first. WordPress builds its loopback and REST URLs from siteurl, so a stale value sends every self-test to the wrong place.
2. Reproduce the REST API item and read the status code. The -w '%{http_code}\n' option prints only the status; -o /dev/null discards the body.
curl -sS -o /dev/null -w '%{http_code}\n' https://example.com/wp-json/wp/v2/types/post200A 200 means the route answers anonymous readers. Now read the body, because a plugin can return a 200 carrying an error:
curl -sS https://example.com/wp-json/wp/v2/types/post | head -c 160{"post":{"description":"","hierarchical":false,"name":"Posts","slug":"post"JSON starting with {"post": is a healthy answer. HTML or a PHP notice at the front of the body means something prints before WordPress sends its response, and the browser test fails on that even at status 200.
3. Read the codes that are not failures. The Site Health test sends your login cookie and adds context=edit. Without a cookie, that request should be refused:
curl -sS -o /dev/null -w '%{http_code}\n' 'https://example.com/wp-json/wp/v2/types/post?context=edit'401A 401 there is correct behaviour, not the fault you are hunting. The codes that do point at a fault are 403, 404 and 500. A 403 with an HTML body usually comes from a security plugin, or from ModSecurity, the Apache request-filtering module cPanel enables by default:
grep -c 'wp-json' /usr/local/apache/logs/modsec_audit.log17Any count above zero means ModSecurity has been matching REST requests. WHM lists the same events with rule numbers under Security Center → ModSecurity Tools → Hits List, which is where you disable one rule for one domain. Turn off that rule id rather than the whole engine.
A 404 with a body of {"code":"rest_no_route" is a rewrite problem instead. Re-save permalinks under Settings → Permalinks, then confirm the account .htaccess still carries the WordPress block. If the failure survives that, the WordPress REST API error guide covers each error code, and the WordPress REST API handbook documents the routes.
4. Restore the Authorization header if application passwords fail. Some cPanel builds run PHP through CGI, which strips the Authorization header before PHP sees it. Test with an application password from Users → Profile:
curl -sS -o /dev/null -w '%{http_code}\n' -u 'admin:xxxx xxxx xxxx xxxx xxxx xxxx' \
https://example.com/wp-json/wp/v2/users/me200If that returns 401 while the same credentials work in the admin, add two lines at the top of the account’s .htaccess:
CGIPassAuth On
SetEnvIf Authorization "(.*)" HTTP_AUTHORIZATION=$1
Re-run the curl command. The 200 appears with no restart needed.
5. Reproduce the loopback item from inside the account. Run this over SSH on the server, not from your laptop, because the question is what the server sees.
curl -sS -o /dev/null -w '%{http_code} %{remote_ip}\n' -X POST https://example.com/wp-cron.php200 198.51.100.40A 200 means loopback works and the item is stale, so reload the page. The %{remote_ip} field shows which address the server actually reached. Now pin the hostname to the local machine and compare:
curl -sS -o /dev/null -w '%{http_code} %{remote_ip}\n' \
  --resolve example.com:443:127.0.0.1 -X POST https://example.com/wp-cron.php
200 127.0.0.1The --resolve option keeps the hostname and certificate intact while sending the packets to the address you name. If the pinned request succeeds and the public one fails, the break is outside the server, in DNS, the CDN or the firewall. If both fail the same way, the break is in WordPress or the vhost, and step 6 sorts it.
For the first case, ask whoever runs the firewall to let the server’s own public address reach ports 80 and 443 on itself. Adding the domain and the server’s internal address to /etc/hosts also works, but that needs root and affects every account on the box.
6. Decide who owns each remaining item before you edit anything. The same shape of answer works for every line on the screen.
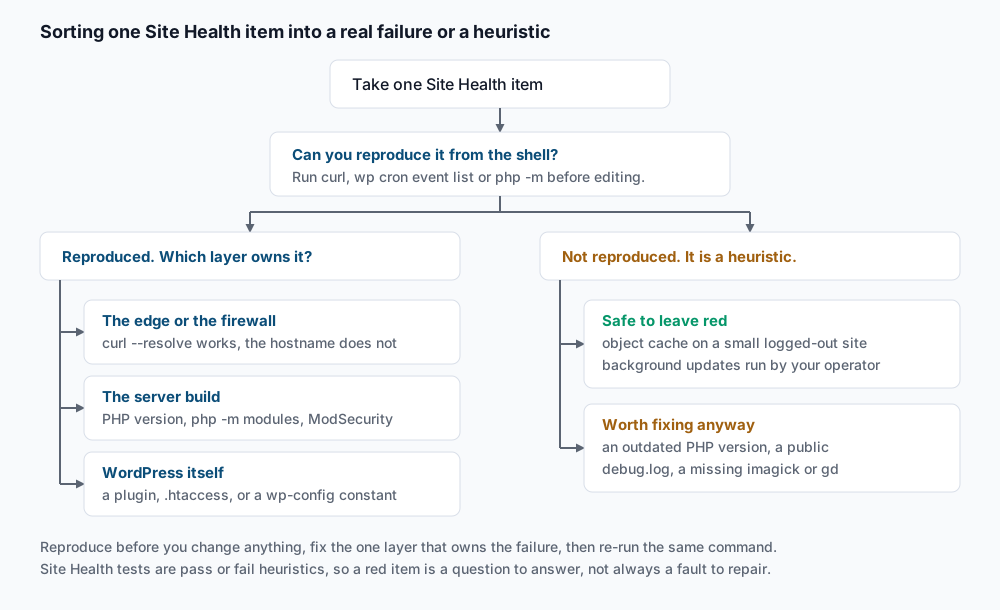
When both loopback requests fail, the usual owner is a plugin. List what runs, then stop candidates one at a time on a staging copy:
wp plugin list --status=active --field=nameakismet
wordfence
woocommerceSecurity, caching and coming-soon plugins are the three families that answer loopback requests with a 403 or a redirect.
7. Fix “A scheduled event has failed”. A hook missed its window. Look at the queue first:
wp cron event list --fields=hook,next_run_relative,recurrence | head -5+------------------------+-------------------+------------+
| hook | next_run_relative | recurrence |
+------------------------+-------------------+------------+
| wp_version_check | 3 hours 12 mins | 12 hours |
| woocommerce_cleanup | now | 1 day |Anything showing now is overdue. Run the backlog by hand:
wp cron event run --due-nowSuccess: Executed a total of 3 cron events.If the events run cleanly by hand and still fail on their own, the cause is pseudo-cron. WordPress fires scheduled work on visitor page loads, so a quiet site never runs it and a loopback failure stops it. The durable fix is to set DISABLE_WP_CRON to true and add a real cron job:
wp config get DISABLE_WP_CRONtrueThen add this entry under cPanel’s Cron Jobs, using your own account path and PHP version:
*/5 * * * * /opt/cpanel/ea-php82/root/usr/bin/php /home/exampleco/public_html/wp-cron.php >/dev/null 2>&1Five minutes suits most sites. Use one minute where an order confirmation or a payment retry has to go out promptly. The full setup, multisite included, is in replacing WP-Cron with system cron.
8. Answer “You should use a persistent object cache” honestly. Check what WordPress is using now:
wp eval 'echo wp_using_ext_object_cache() ? "external" : "internal", "\n";'internalThis item is a recommendation, never a critical issue. A persistent object cache stores database query results between requests, usually in Redis. It pays off when most visitors are logged in, when WooCommerce or a membership plugin runs, or when your slowest pages spend their time in the database. It changes little on a brochure site that serves the same cached HTML to everyone. The measurement that settles it is in the persistent object cache recommendation.
9. Set the PHP version and add missing extensions. The php binary in your shell often differs from the one serving the site, so check both:
php -v
/opt/cpanel/ea-php82/root/usr/bin/php -v
PHP 8.1.29 (cli) (built: Jun 12 2026 11:20:41) (NTS)
PHP 8.2.23 (cli) (built: Sep 3 2026 09:11:02) (NTS)The path under /opt/cpanel/ea-phpXX/ is the binary for one PHP version built by EasyApache 4, the cPanel component that packages Apache and PHP. Set a domain’s version under Software → MultiPHP Manager, picking the newest one your plugins support. Then check the image libraries:
/opt/cpanel/ea-php82/root/usr/bin/php -m | grep -Ei '^gd$|^imagick$'gdWordPress uses imagick when present and falls back to gd, and both resize and crop images. imagick, the PHP binding for ImageMagick, also reads PDFs and keeps colour profiles, which is why Site Health names it. A site with only gd works. To add it, a root user installs the EasyApache 4 package for that exact PHP version:
dnf install -y ea-php82-php-imagickInstalled:
ea-php82-php-imagick-3.7.0-1.el8.x86_64WHM does the same under Software → EasyApache 4 → Customize → PHP Extensions. Verify against the same binary:
/opt/cpanel/ea-php82/root/usr/bin/php -i | grep -i 'imagick module'imagick module => enabled
imagick module version => 3.7.0Per-account settings such as memory_limit belong in cPanel’s MultiPHP INI Editor, which writes them for the version that account runs. cPanel’s reference for these screens sits at docs.cpanel.net.
10. Move the debug log out of the document root. The item about logging errors to a potentially public file means WP_DEBUG_LOG is on and the log sits where visitors can read it.
wp config get WP_DEBUG_LOG
curl -sS -o /dev/null -w '%{http_code}\n' https://example.com/wp-content/debug.log
true
200That 200 confirms anyone can download the file. Debug logs carry file paths, database errors and sometimes tokens, so move it above the document root rather than hiding it with a rewrite rule. Edit wp-config.php:
define( 'WP_DEBUG_LOG', '/home/exampleco/logs/wp-debug.log' );Create the directory, then confirm the old URL is gone and the new file is filling:
mkdir -p /home/exampleco/logs
curl -sS -o /dev/null -w '%{http_code}\n' https://example.com/wp-content/debug.log
tail -2 /home/exampleco/logs/wp-debug.log
404
[11-Sep-2026 14:02:55 UTC] PHP Notice: Function _load_textdomain_just_in_time was called incorrectly.If you are not actively debugging, set WP_DEBUG_LOG to false instead.
11. Read the background updates and HTTPS items. Background updates go red when AUTOMATIC_UPDATER_DISABLED is defined, when the WordPress directory is not writable, or when loopback already failed. Fix loopback first and this often clears itself. The HTTPS item checks that both addresses from step 1 use https and that the certificate validates:
curl -sS -o /dev/null -w '%{http_code} %{ssl_verify_result}\n' https://example.com/200 0A 0 in the second field means the chain verified. Any other number means it is incomplete or expired, which you renew under Security → SSL/TLS Status.
Validate it works
Run the three requests Site Health cares about, from the server:
for u in / /wp-json/wp/v2/types/post /wp-cron.php; do
  printf '%-28s ' "$u"
  curl -sS -o /dev/null -w '%{http_code}\n' -X POST "https://example.com$u"
done
/ 200
/wp-json/wp/v2/types/post 200
/wp-cron.php 200Three 200 lines mean the network side is healthy. Confirm the scheduler moved on by looking for future run times rather than now:
wp cron event list --fields=hook,next_run_relative | head -4| wp_version_check | 11 hours 44 mins |
| woocommerce_cleanup | 22 hours 3 mins |Then reload Tools → Site Health and let the async tests run again. The screen caches its last result, so do a hard refresh before deciding a fix did not work.
Troubleshooting
Site Health still shows the old error after a successful curl. The browser tests carry your login cookie and use your browser’s DNS view, and curl on the server has neither. Reload once, then look for a WAF rule that treats browser traffic differently.
The loopback test passes over --resolve and fails on the public address. The break is outside the server. Take it to whoever runs the CDN or the firewall.
Every REST request returns 403 with an HTML body, including from curl. That is ModSecurity or a security plugin. The grep in step 3 says which, because a plugin leaves nothing in modsec_audit.log.
PHP version changed but Site Health reports the old one. A domain and its subdomains can run different versions. An alias may also still point at the old handler. Check every entry for the account, then confirm over HTTP rather than from the shell.
When this is the wrong approach
Some Site Health items are safe to leave red, and knowing which ones saves wasted work. Ignore the object cache recommendation when visitors are mostly logged out. The background updates warning is expected when your host patches on a controlled schedule. The imagick item can stay if you serve no PDFs and no print-quality photography. Warnings about an inactive theme, or the page cache test on a CDN-served site, are cosmetic. Each reports a difference from a typical install, not a fault.
Three items deserve action every time. An outdated PHP version and a readable debug log are security exposure. A failing loopback request quietly stops scheduled work, updates and several plugin features.
Site Health is also the wrong tool for performance questions. It reports on configuration, not on what visitors experience, so a site that passes every check can still be slow. On shared hosting without root, steps 3, 5 and 9 are not yours to run. Send your host the curl output above, because a status code and a remote_ip turn a vague ticket into one they can act on.
Running WordPress that earns real money deserves an operator — Stack Harbor runs that stack under Enterprise WordPress; book an infrastructure consult.