Every enterprise WordPress hosting page lists the same nine or ten features, in the same words, whether the platform underneath is built for scale or is a reseller account with a nicer dashboard. The only way to tell them apart is to open a trial, get a shell or an SSH-backed WP-CLI session, and check each property yourself. This page is that checklist, with the command that proves or disproves each claim in under a minute. In short, a serious platform gives you a sized PHP worker pool you can reason about, a persistent object cache that is actually connected, a full-page cache that serves logged-out traffic and correctly steps aside for carts and sessions, staging that carries the database, a self-serve restore with a number attached, real tenancy boundaries, a git or CI deploy path, and logs you can read without opening a ticket. Anything a vendor cannot demonstrate on a trial account is a claim, not a property.
What you’ll accomplish
- Turn a feature list into nine checks you can run on a trial account in about an hour.
- Prove the object cache and the full-page cache are connected and serving, not merely installed.
- Measure where the PHP worker pool queues, and read the response-time cliff honestly.
- Establish the real backup window and restore time by restoring something.
- Leave with a short list of properties the vendor must confirm in writing.
Prerequisites
- A trial or sandbox account with a real WordPress install on it. An empty account tells you almost nothing.
- SSH, or a shell with WP-CLI. Many managed platforms expose WP-CLI without a general shell; most checks below still run. If neither exists, that absence is itself a finding.
- WP-CLI 2.x and WordPress 6.x. Every
wpcommand below ships with core WP-CLI exceptwp redis status, which comes from the Redis Object Cache plugin and only exists if that plugin is active. curl7.66 or newer if you want to test HTTP/3;--http3is marked experimental in many distribution builds, and a build without it will say so.- Optional:
heyor ApacheBench (ab) for a load probe. Read the caveat in step 5 first. - Paths, log locations and cache header names differ by platform. The vendor’s documentation is the authority for its own product.
How it works
A WordPress request passes through a fixed set of layers, and each requirement belongs to exactly one of them. Knowing which layer owns a property stops you testing the wrong thing: a slow page with x-cache: HIT is not a PHP problem, and a fast page under no load says nothing about worker sizing.
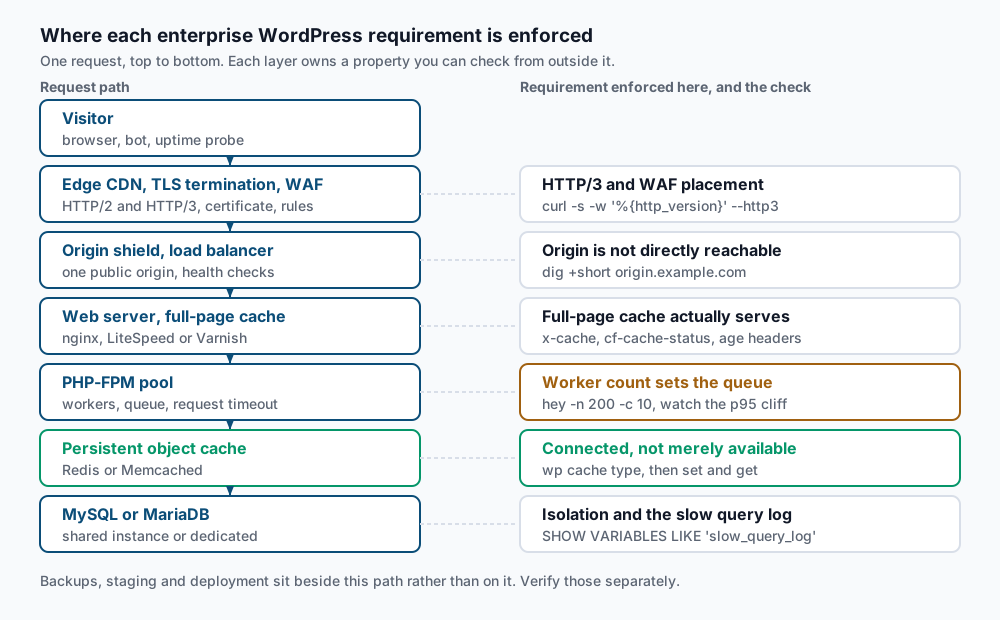
Two of these deserve a note before you start.
PHP workers are the hard ceiling. PHP-FPM runs a fixed pool of child processes, each handling one request start to finish. If pm.max_children is 20 and 20 requests are in flight, request 21 waits in the listen backlog for as long as the slowest of those 20 takes. This is why a site comfortable at 40 requests per second falls off a cliff at 45 rather than degrading gently: you are not out of CPU, you are out of workers. The sizing arithmetic is in calculating pm.max_children; what matters here is whether the platform will tell you the number at all.
Object cache and page cache are different layers. The full-page cache stores rendered HTML and answers without invoking PHP. The object cache sits below PHP and absorbs repeated database queries when the page cache misses, which is every logged-in request, every cart, every admin screen. A platform with only a page cache looks excellent in a synthetic homepage benchmark and falls over on a busy WooCommerce checkout. The distinction is set out in object cache versus page cache.
Step-by-step
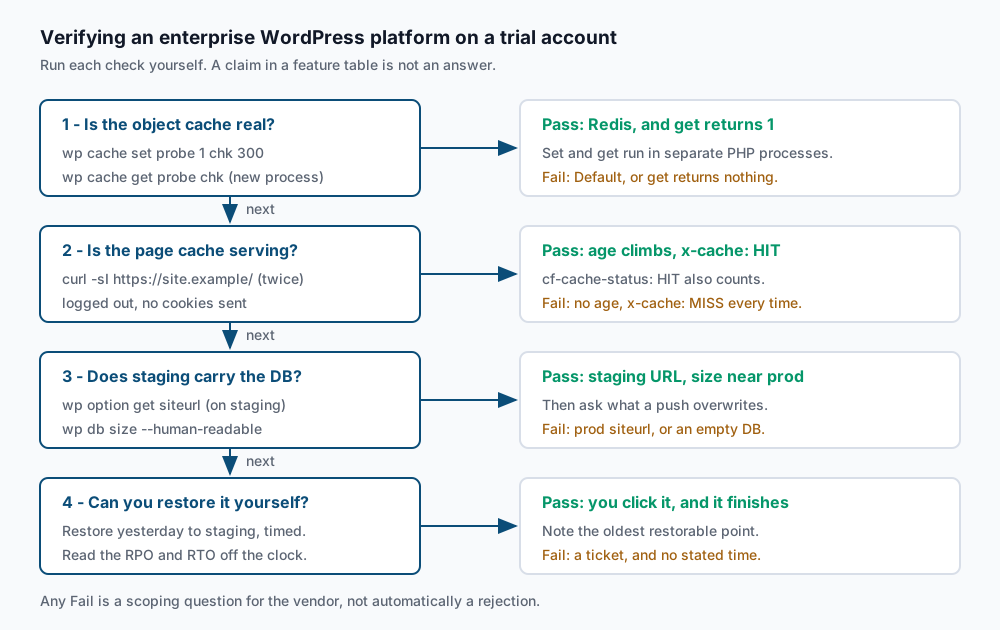
Work down the tree. Each node has a command, an expected output, and a failure mode worth acting on.
-
Confirm you have a real WP-CLI, and see what PHP you are on.
wp --infoOS: Linux 6.8.0 x86_64 PHP binary: /usr/bin/php8.3 PHP version: 8.3.14 WP-CLI version: 2.11.0A PHP version below 8.1 on a platform sold for enterprise WordPress is a finding on its own. If
wpis missing entirely, ask why before going further. -
Test whether the object cache is persistent, not just present.
wp cache typereports what WordPress thinks it is using, but a misconfigured drop-in reports a backend it never reaches. The real test is to write in one process and read in another:wp cache type wp cache set probe 1 chk 300 wp cache get probe chkRedis Success: Set object 'probe' in group 'chk'. 1Each
wpinvocation is a separate PHP process, so a value surviving from thesetto thegetcan only have come from a shared backend. Ifwp cache typesaysDefault, WordPress is using the non-persistent in-memory cache and every request re-runs the same option and meta queries. If it names Redis but thegetreturns nothing, the drop-in is installed and the connection is failing silently, which is the more common and more misleading failure.Where the Redis Object Cache plugin is active:
wp redis statusStatus: Connected Client: PhpRedis (v6.0.2) Drop-in: Valid Disabled: NoThose four lines are the ones that matter; the command then prints a long diagnostics dump of client versions, timeouts and every
WP_REDIS_*constant that is defined.And from a shell that can reach the cache directly:
redis-cli pingPONG -
Check how much work the object cache is being asked to do.
wp db size --human-readable
wp db query "SELECT ROUND(SUM(LENGTH(option_value))/1024) AS autoload_kb FROM wp_options WHERE autoload IN ('yes','on','auto-on','auto');"
+---------+--------+ | Name | Size | +---------+--------+ | wp_prod | 4.2 GB | +---------+--------+ autoload_kb 1840Autoloaded options are read on every request. Past roughly 800 KB a persistent object cache stops being optional, and the number is something concrete to hand the vendor when you ask what their cache is sized for.
-
Prove the full-page cache serves logged-out traffic, and steps aside when it must.
Fetch a public page twice, a few seconds apart:
curl -sI https://site.example/ | grep -Ei 'x-cache|cf-cache-status|age|cache-control|server|x-powered-by'server: cloudflare cache-control: max-age=0, s-maxage=300 cf-cache-status: HIT age: 47A climbing
ageacross two fetches is the honest signal: the response came from a store rather than a fresh render.x-cache: HIT,cf-cache-status: HITandx-litespeed-cache: hitare all valid depending on the stack. A missingagewithMISSevery time means the page cache is not working for anonymous traffic, the easiest case there is.Now check it refuses to cache a session. Send a cookie WordPress treats as a logged-in marker:
curl -sI -H 'Cookie: wordpress_logged_in_probe=1' https://site.example/ | grep -Ei 'cf-cache-status|x-cache|^age:'cf-cache-status: BYPASSBYPASSorMISSis the correct answer. AHIThere means cached HTML is being served to sessions, and on a WooCommerce site that is how one customer sees another customer’s cart. Repeat against a URL with a query string (https://site.example/?utm_source=probe) and ask which parameters go into the cache key; a stack that keys on every parameter has a cache that campaign tags will shred. -
Find the worker cliff, carefully.
A small load probe tells you where the queue starts. It does not tell you the site’s capacity, and run from a laptop it mostly measures your own uplink. Run it against staging, never production, and only with the vendor’s agreement:
hey -n 200 -c 10 https://staging.site.example/?nocache=1Summary: Total: 9.1 sec Requests/sec: 21.9 Latency distribution: 50% in 0.41 secs 95% in 1.87 secs 99% in 4.02 secsThe
?nocache=1is there to defeat the page cache so you are measuring PHP; confirm it does withcurl -sIfirst. Read the shape, not the number: if p50 stays flat while p95 and p99 climb steeply as you raise-c, you have found the worker count. Then ask whatpmmode andpm.max_childrenthe plan runs, and whether that number is per site or shared across the account. A vendor that will not say is telling you something. -
Test staging as a real environment, not a copy of the files.
From the staging shell:
wp option get siteurl
wp db size --human-readable
wp post list --post_type=post --format=count
https://staging.site.example +------------+--------+ | Name | Size | +------------+--------+ | wp_staging | 4.1 GB | +------------+--------+ 18422A staging site whose
siteurlstill points at production is a search-and-replace that did not happen, and it will send real messages and real webhooks. A near-empty database means staging is files-only, useless for testing a migration or a plugin update against real content. Then ask what the dashboard will not tell you: on push to production, what happens to the database? The three real answers are files only, files plus database overwriting production, and files plus a selected table set. Only the first is safe on a site that takes orders, and only if you know it. -
Establish RPO and RTO by restoring something.
Restore yesterday’s backup into staging and time it with a clock. Record three numbers: how far back the oldest restorable point is, how long the restore took end to end, and whether you ran it yourself or filed a ticket. Take a fingerprint before and after:
wp db size --human-readable && wp post list --post_type=post --format=count+------------+--------+ | Name | Size | +------------+--------+ | wp_staging | 4.1 GB | +------------+--------+ 18422If the restore is self-serve and finished while you watched, you have a recovery-time figure to plan against. If it needed a ticket, the recovery time is whatever the queue is, and that belongs in the evaluation.
-
Check the tenancy boundary.
wp config get DB_HOST
wp db query "SHOW GLOBAL VARIABLES LIKE 'max_connections';"
nproc
cat /sys/fs/cgroup/memory.max
db-cluster-7.internal:3306 Variable_name Value max_connections 500 8 4294967296A
DB_HOSToflocalhostmeans MySQL shares the web container with PHP and the two compete for the same memory. A remote host says nothing about whether it is dedicated, so ask. The cgroup file is the more useful signal: a real byte limit means a container with a memory ceiling.nprocmay report the host’s CPU count rather than your share, so treat it as a hint. On cgroup v1 the path is/sys/fs/cgroup/memory/memory.limit_in_bytes, and a value near 2^63 means no limit is set. -
Establish how code gets deployed, and what logs you can read.
ls -a /path/to/site/ | grep -E '^\.git$|^\.gitignore$'
ls -la ~/logs/ 2>/dev/null || ls -la /var/log/php-fpm/ 2>/dev/null
wp config get WP_DEBUG_LOG
.git .gitignore -rw-r--r-- 1 site site 8.4M Sep 9 03:12 access.log -rw-r--r-- 1 site site 212K Sep 9 03:10 error.log /home/site/logs/wp-debug.logA
.gitdirectory in the docroot means the platform supports a git-based deploy; its absence usually means SFTP or a proprietary uploader, workable but hostile to CI. For logs, three things matter and none are on a feature page: whether the raw access log is readable by you, how many days are retained, and whether the MySQL slow query log is on and reachable. Check the last from WP-CLI:wp db query "SHOW VARIABLES LIKE 'slow_query_log'; SHOW VARIABLES LIKE 'long_query_time';"Variable_name Value slow_query_log ON Variable_name Value long_query_time 1.000000slow_query_logset toOFF, or on with no way to read the file, means every future database investigation starts with a support request.
Validate it works
Run the set end to end and write down nine answers. A platform worth shortlisting produces something like this:
wp --info | grep 'PHP version'
wp cache type
curl -sI https://site.example/ | grep -Ei '^age:|cache-status'
curl -s -o /dev/null -w '%{http_version}\n' https://site.example/
wp option get siteurl
wp config get DB_HOST
PHP version: 8.3.14
Redis
cf-cache-status: HIT
age: 112
2
https://site.example
db-cluster-7.internal:3306The %{http_version} output is 2 for HTTP/2 and 3 for HTTP/3; add --http3 to test whether the edge negotiates it at all. A curl built without HTTP/3 support says so rather than lying about the result.
Anything you could not answer from a shell becomes a written question for the vendor, with a number attached: not “do you offer object caching” but “is the object cache persistent across processes, and what is its memory ceiling on this plan”.
Reading the answers together
No platform passes everything, and a failed check is a scoping question rather than a rejection. What matters is whether the gaps line up with your workload. A content site with heavy anonymous traffic can live with a modest worker pool if the page cache hit ratio is high; that traffic shape is the subject of the enterprise publisher stack. A transactional site cannot: carts and checkouts bypass the page cache by design and land on PHP and the database every time.
Troubleshooting
wp cache type reports Redis but nothing persists. The object-cache.php drop-in is in place and the connection is failing: wrong host, port or password, or a firewall between the web tier and the cache. Confirm with wp redis status if the plugin is present; a Status: Not connected line makes it explicit. Silent failure is the default, which is why the set-and-get test beats the type report.
Every page shows cf-cache-status: DYNAMIC. Cloudflare is proxying but no cache rule matches HTML, so the CDN is doing TLS and WAF only. That is a configuration gap rather than a platform limit, but on a managed plan it should already be configured. Ask who owns that rule set before you sign.
The load probe shows terrible numbers everywhere. Check for rate limiting first. Many WAFs throttle or challenge a burst of identical requests from one IP, and you end up measuring the WAF instead of the origin. A wall of 429 or 403 responses in the hey status breakdown is the tell. Coordinate the test with the vendor, or the result is meaningless.
nproc and free -m report the host, not your container. Both read host-level interfaces on many container runtimes. Trust the cgroup file for memory, and treat CPU as unknown until the vendor states the share.
Staging push silently reverts a plugin setting. Almost always the push carried the database and overwrote production wp_options. That is the failure mode of a files-plus-database push nobody told you about, and why step 6 asks the question instead of trusting the button label.
When this is the wrong approach
This checklist is scaled for a WordPress site where an outage costs real money: a store, a membership platform, a publisher with contracted ad delivery. For a brochure site with a few hundred visitors a day it is over-engineering, and a good shared plan with a page cache will beat a badly configured platform at many times the price.
It is also the wrong lens if your problem is the application rather than the platform. A theme running 400 queries per page view is slow on any infrastructure, and a plugin holding a worker for eight seconds on an external API call is not fixed by a bigger pool, only delayed. Profile the application first; if the slow query log is full of the same query and the object cache is already connected, the answer is in the code.
This page also stops deliberately at platform properties. What happens when something breaks at 02:00 is covered in the enterprise WordPress support model, and whether to buy a platform at all is covered in managed versus self-managed WordPress hosting. The commands come from the WP-CLI command reference, and the project’s own baseline for hosts is the WordPress hosting handbook.
Running WordPress that earns real money deserves an operator — Stack Harbor runs that stack under Enterprise WordPress; book an infrastructure consult.