Enterprise WordPress support is the contract that says who fixes what, and how fast, when a WordPress site that earns money breaks. If you have to draft, review or push back on one, most disagreements with a provider come down to four clauses. They cover what is in scope, how severity is defined, which clock runs at each escalation step, and who approves a change. A response-time promise does not cover the fix, so a provider can acknowledge your ticket within fifteen minutes and still leave checkout broken for six hours. Write those clauses in terms both sides can observe, and run your own uptime probe so a disputed incident has timestamps instead of memories.
What you’ll accomplish
- Find the scope boundary in an agreement where “your developer’s plugin” begins — the commonest cause of a stalled ticket.
- Write severity definitions a stranger at 2am can apply without calling you.
- Map every recurring task — updates, patching, backups, restores, custom code — to exactly one named owner.
- Stand up an independent uptime and latency probe from a second vantage point.
- Produce the core, PHP and plugin inventory a well-run provider asks for before scoping.
Prerequisites
- A WordPress install reachable over SSH with WP-CLI available;
wp --infoshould succeed. If it does not, the inventory steps have slower GUI equivalents. curlon a machine that is not your web host. A laptop is fine for spot checks, but the cron probe belongs on a small instance in a different network, ideally a different provider. Any curl from 7.29 onward has the write-out variables used here.- Access to your web and PHP error logs. On cPanel that is usually
~/logs; on Debian-family servers,/var/log/apache2or/var/log/nginx. - The support agreement, draft or current. If you have never been sent a written severity table, that absence is itself the finding.
How it works
An enterprise support arrangement is a chain of handoffs, and each handoff has its own clock. Understanding which clock is running at which hop is what lets you write a meaningful commitment instead of a number that sounds reassuring.
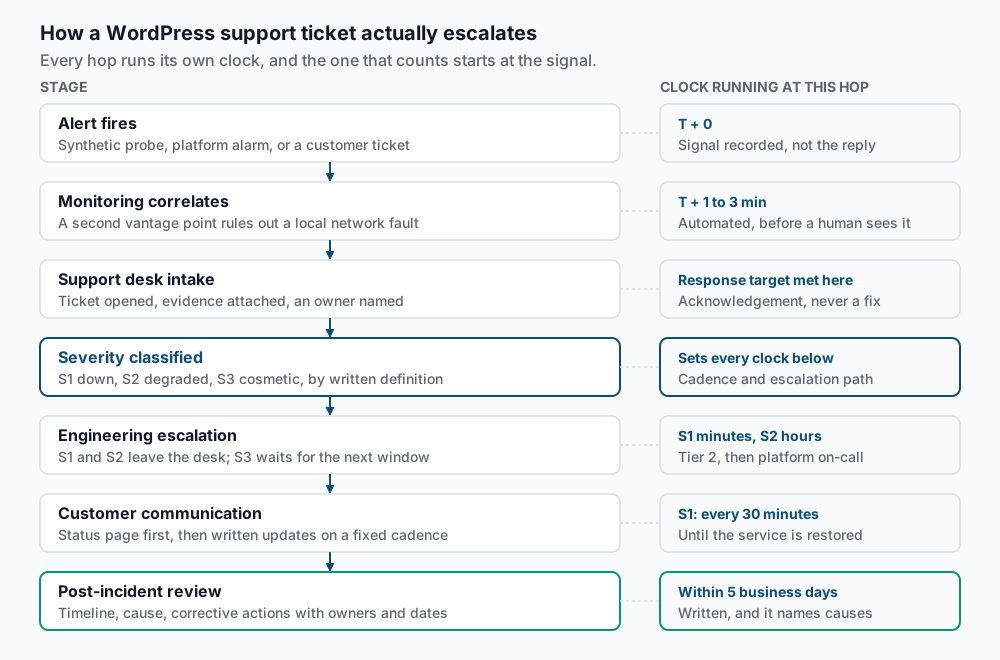
Three things in that chain are routinely written badly.
The first is where the clock starts. If the agreement says “response within 15 minutes of ticket creation” and tickets are created by a human reading a monitoring dashboard, the provider controls the start time. The clock should start at the alert signal, and the agreement should say the monitoring system opens the ticket automatically.
The second is what a response is. An acknowledgement is a response; it is not a diagnosis, an owner, or an estimate. A useful agreement commits to three separate things: acknowledgement, a named owner with a severity assignment, and an update cadence that continues until service is restored. Resolution time is generally not commitable for a system carrying third-party code, and a provider who commits to one is either padding the number heavily or has not read their own contract.
The third is who is actually working the ticket. A realistic model has tiers: a support desk that receives everything, reproduces, gathers evidence and closes most tickets from runbooks; a second tier owning anything that touches the platform; and a platform on-call rotation reached only when severity and elapsed time say so. Any provider implying a senior engineer personally picks up every ticket is describing a business that cannot survive its own volume. Ask what share of tickets close at first tier, and what the escalation trigger is.
Channels matter too. Technical work flows through the support desk and its ticket trail, because that is where evidence accumulates; the phone number you hold is your account manager, for commercial escalation. Confusing the two is how a critical issue becomes a voicemail nobody timestamps.
What the contract must scope
Scope disputes are the reason tickets sit. Before you argue about response times, settle the matrix below — every row needs exactly one owner, and both parties need to have read the same version of it.
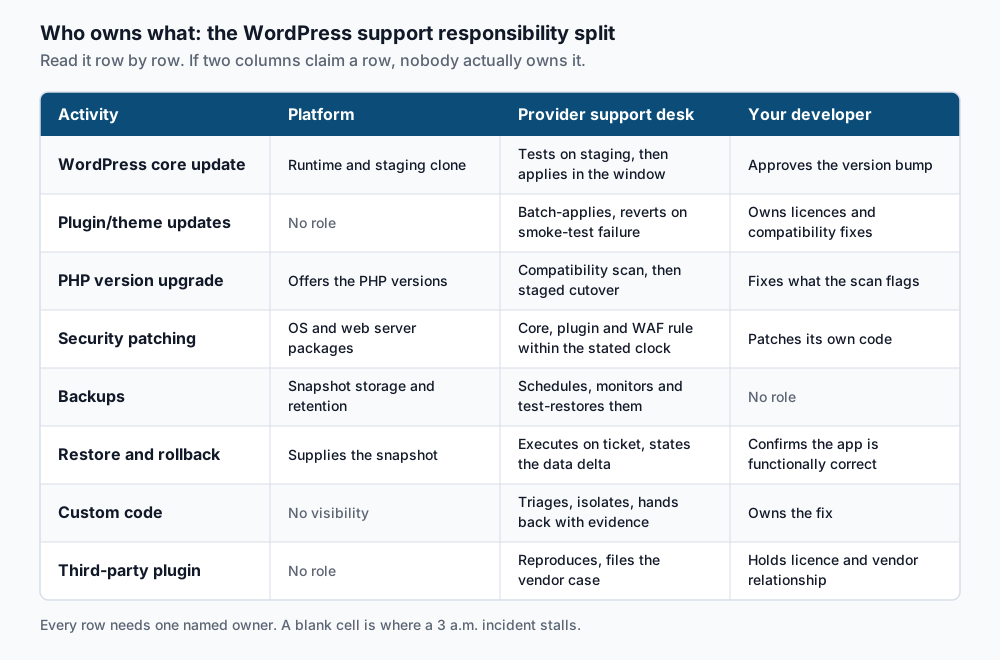
The boundary that causes real pain is custom code. A provider can reasonably commit to triage — reproduce the fault, isolate it to a plugin or theme, hand back a stack trace and a reproduction — but not to fixing code they did not write and cannot test. Insist that the handback is evidenced: the ticket names the file, the hook and the request that triggers it, rather than “third-party plugin conflict, contact your developer”. In exchange you supply a reachable owner for that code. A custom plugin whose author left the agency two years ago is an unowned dependency, and the agreement should force you to name someone for each one.
Change management deserves its own clauses. At minimum: a maintenance window with a timezone; who approves a core version bump and where that approval is recorded; whether minor core releases are auto-applied and major ones held; the rollback plan per class of change, including the point at which rollback beats fixing forward; and an emergency path for a security release that cannot wait, with retroactive notification instead of prior approval. A change that cannot be rolled back is a migration, and it belongs in a project, not a window.
Severity, and why response time is not resolution time
Severity definitions fail when they are written in terms of how upset someone is. Write them in terms of observable state, so the person on the desk at 2am classifies the same way you would.
| Severity | Definition | Update cadence | Escalation |
|---|---|---|---|
| S1 | Site unreachable, checkout or login failing for all users, or data at risk | Every 30 minutes until restored | Immediate to second tier |
| S2 | Degraded: a section broken, response times multiples of baseline, one payment method failing | Every 2 hours during business hours | Second tier if unresolved at the desk after 60 minutes |
| S3 | Cosmetic or single-user, workaround exists, no revenue impact | Daily | Next maintenance window |
Two details make this usable. Severity must be assignable from evidence you can both see — “multiples of baseline” only works if a baseline is recorded somewhere. And it must move in one direction without argument: the customer can raise severity, the provider can only lower it with a written reason on the ticket. Without that asymmetry, every disagreement becomes a negotiation while the site is down.
Step-by-step
1. Stand up your own uptime probe from a second vantage point. Run this on a small instance that is not your web host and not on the same provider network.
mkdir -p ~/uptime
cat > ~/uptime/probe.sh <<'EOF'
#!/bin/sh
URL="https://example.com/"
STAMP=$(date -u +%Y-%m-%dT%H:%M:%SZ)
RESULT=$(curl -sS -o /dev/null -m 15 -A "acme-uptime-probe/1.0" \
  -w '%{http_code} %{time_namelookup} %{time_connect} %{time_appconnect} %{time_starttransfer} %{time_total}' \
  "$URL" 2>&1)
echo "$STAMP $RESULT" >> "$HOME/uptime/probe.log"
EOF
chmod +x ~/uptime/probe.sh
~/uptime/probe.sh && tail -n 1 ~/uptime/probe.log
Expected output — one line, six fields after the timestamp:
2026-09-09T14:02:01Z 200 0.004316 0.020901 0.058442 0.214883 0.2210042. Schedule it every minute and keep the log. Use an absolute path; cron does not read your shell profile.
( crontab -l 2>/dev/null; echo "* * * * * /home/deploy/uptime/probe.sh" ) | crontab -
crontab -l | tail -n 1
Expected output:
* * * * * /home/deploy/uptime/probe.shReplace /home/deploy with your own path. wc -l ~/uptime/probe.log should climb by one per minute.
3. Capture a timing breakdown you can attach to a ticket. When someone says “the site feels slow”, this turns the claim into a number and points at a layer.
cat > ~/curl-timing.txt <<'EOF'
     dns:  %{time_namelookup}s
 connect:  %{time_connect}s
     tls:  %{time_appconnect}s
    ttfb:  %{time_starttransfer}s
   total:  %{time_total}s
    code:  %{http_code}
EOF
curl -sS -o /dev/null -w "@$HOME/curl-timing.txt" https://example.com/
Expected output:
     dns:  0.004316s
 connect:  0.020901s
     tls:  0.058442s
    ttfb:  0.214883s
   total:  0.221004s
    code:  200
Read it as a subtraction: TTFB minus TLS time is what the origin actually spent thinking. If that gap is 1.8 seconds while connect is 0.02, the network is fine and the ticket is about PHP or the database — a very different ticket from one where time_connect is slow.
4. Produce the inventory a provider will ask for. Run this from the WordPress docroot.
wp core version --extraExpected output:
WordPress version: 6.6.2
Database revision: 57155
TinyMCE version:   4.9110 (49110-20201110)
Package language:  en_US
Then the plugin list, in a format a human and a spreadsheet can both read:
wp plugin list --format=csv --fields=name,status,version,update,update_versionExpected output:
name,status,version,update,update_version
akismet,active,5.3.7,none,
woocommerce,active,9.1.4,available,9.2.2
acme-custom-shipping,active,1.0.0,none,
Anything in that list you do not recognise, or whose version has not moved in two years, is a row that needs a named owner before you sign anything.
5. Bundle it into one dated artifact.
{ echo "## core";    wp core version --extra
  echo "## php";     php -v | head -n 1
  echo "## plugins"; wp plugin list --format=csv --fields=name,status,version,update
  echo "## themes";  wp theme list --format=csv --fields=name,status,version
} > "inventory-$(date -u +%F).txt"
wc -l "inventory-$(date -u +%F).txt"
Expected output:
64 inventory-2026-09-09.txt6. Check how long your evidence survives. A review written five days later is worthless if the logs rotated after two.
ls -lt ~/logs/ 2>/dev/null | head -n 4Expected output on a cPanel-style host:
total 48920
-rw-r----- 1 deploy deploy 12093440 Sep  9 14:05 example.com-ssl_log
-rw-r----- 1 deploy deploy   903214 Sep  9 14:05 example.com
-rw-r----- 1 deploy deploy  4210338 Sep  1 00:12 example.com-Aug-2026.gz
On a server you administer, read the rotation policy directly:
grep -E 'daily|weekly|monthly|rotate' /etc/logrotate.d/apache2Expected output:
	daily
	rotate 14
That is 14 days of web logs. Compare it against the post-incident review deadline in your agreement: a review due in 10 business days against 14 calendar days of logs leaves almost no margin. The fix is a clause requiring the provider to snapshot relevant logs at incident open.
7. Confirm the status page is not hosted inside the thing that fails.
curl -sS -o /dev/null -w '%{remote_ip} %{http_code}\n' https://status.example.com/
curl -sS -o /dev/null -w '%{remote_ip} %{http_code}\n' https://example.com/
Expected output — two different addresses:
104.18.22.7 200
198.51.100.24 200
If both resolve into the same infrastructure, the status page will be unavailable during exactly the incident you needed it for.
Validate it works
Simulate the evidence trail end to end. Take the site off the air deliberately during your own maintenance window — a paused PHP-FPM pool is enough — and confirm each link fired.
grep -c ' 200 ' ~/uptime/probe.log
awk '$2 != 200 {print}' ~/uptime/probe.log | tail -n 5
Expected output — the count of healthy checks, then the failures with their timestamps:
1438
2026-09-09T21:14:01Z 000 0.004102 0.021044 0.000000 0.000000 15.001233
2026-09-09T21:15:01Z 503 0.004310 0.020880 0.058221 0.881003 0.882117
An HTTP code of 000 with a total near your -m value is a timeout, not a 5xx — the distinction matters, because the two point at different layers.
Then check the human side against those timestamps: an alert reached the provider’s monitoring, a ticket exists with a severity assigned, and the first update landed inside the stated cadence. Every hop that did not fire is a clause to renegotiate. Rehearse a restore the same way, following verifying a WordPress backup is actually restorable — an untested restore path is the clause most likely to fail on the night it is needed.
Questions to ask, and the answers that are red flags
- “What share of tickets close at first tier, and what triggers escalation?” A number and a trigger is a good answer. “Everything goes straight to a senior engineer” is a red flag: no triage layer, no runbooks.
- “Show me a redacted post-incident review from last quarter.” A real one has a minute-by-minute timeline, a cause, and corrective actions with owners and dates. Prose ending in “we apologise for the inconvenience” is a red flag.
- “Who approves a core version bump, and where is that recorded?” If the answer is “we just keep you updated”, nobody owns the rollback.
- “How long do you retain logs, and do you snapshot them at incident open?” Vagueness predicts an evidence-free dispute later.
- “What happens when the fault is in a plugin we paid for?” You want triage plus a filed vendor case, and a clear statement that you hold the licence.
- Any provider promising that outages simply will not happen, or citing a compliance certification without naming which entity in the supply chain actually holds it, is describing marketing rather than operations.
Troubleshooting
The cron probe writes nothing. Cron runs with a minimal environment. Confirm the job ran with grep CRON /var/log/syslog | tail, then check that curl and date resolve — use absolute paths such as /usr/bin/curl in the script if they do not.
The probe reports failures the site never had. A WAF or bot rule is blocking it. That is why the script sets -A "acme-uptime-probe/1.0": give the probe a stable identity, have it allowlisted, and never let a monitoring check hide behind a browser user agent.
wp says this does not seem to be a WordPress installation. You are not in the docroot. Pass it explicitly: wp core version --path=/home/deploy/public_html. On multisite, add --url= for anything site-scoped.
time_appconnect is 0.000000 on an HTTPS URL. You are being redirected before TLS completes, or you probed the plain-HTTP URL and curl followed nothing. Probe the exact canonical URL, and add -L only if you deliberately want to measure the whole redirect chain rather than a single hop.
Your timings look fine and users still complain. A single curl measures one uncached request from one network. Repeat from a second region, and check whether the slow path is logged-in traffic bypassing the page cache — a different diagnosis, and one that lives in the staging-to-production shape rather than the support contract. Every write-out variable used above is documented in the curl manual.
When this is the wrong approach
A formal support model has real overhead — severity tables, windows, approvals, reviews — and it is not free to operate on your side either. For a low-traffic brochure site where a two-hour outage costs nothing measurable, a plain maintenance arrangement is the honest answer, and an S1 clause is theatre.
It is the wrong instrument, too, if you already run your own on-call rotation with people who know the application; what you need then is escalation into the platform layer, not a desk duplicating your triage.
And no contract compensates for an architecture that resists being operated: no severity table fixes a site with no staging environment, no rollback path and one unversioned copy of production. Those are platform properties rather than contract clauses, and they are worth proving on a candidate host before the agreement is drafted — the checks are in enterprise WordPress hosting requirements. Fix operability first, then write the agreement around it — and never let a provider’s backup clause stand in for your own verified restore. The clause describes an obligation; your restore test describes reality.
Running WordPress that earns real money deserves an operator — Stack Harbor runs that stack under Enterprise WordPress; book an infrastructure consult.