The Rates and Limits tabs of Infrastructure Billing answer two questions. What does each resource cost per hour? And how much more can you create before you reach a limit?
Open the tabs
- In the side menu, open Infrastructure, then Billing under Account.
- Select the Rates tab or the Limits tab.
You can also search for Infrastructure Rates or Infrastructure Limits.
- Rates is open to the account owner and to members with Access Billing or See Usage & Costs.
- Limits is open to the account owner and to members with Access Billing.
Read the rates
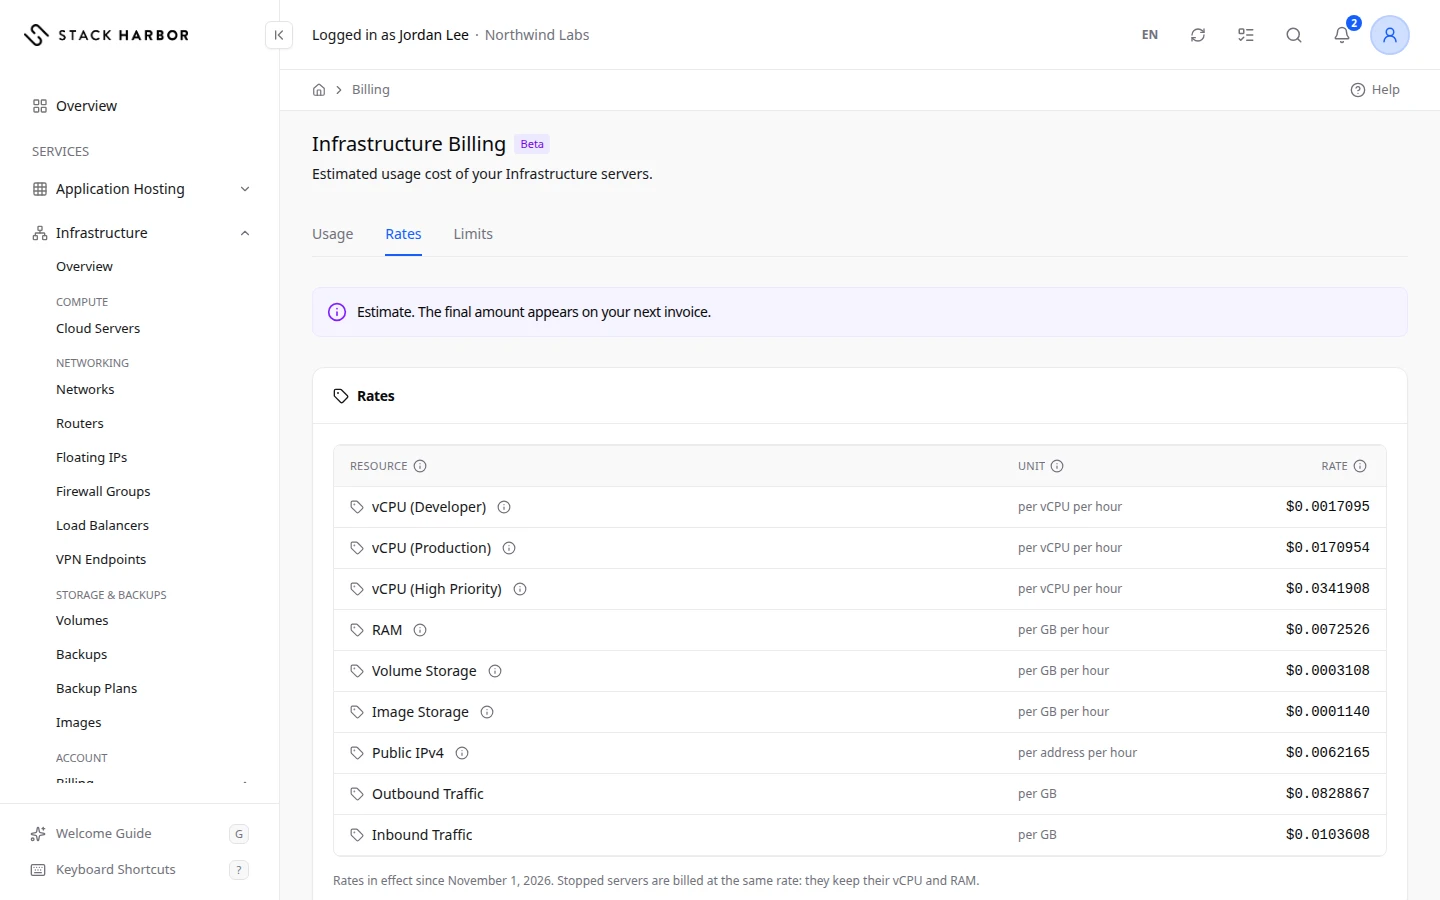
The Rates card lists what each resource costs while you use it. Each row shows:
- Resource: what is billed, such as vCPU, RAM, Volume Storage, Public IPv4, Backup Storage or Image Storage.
- Unit: how it is counted, such as per vCPU per hour, per GB per hour or per address per hour.
- Rate: the price for one unit.
A server is billed for its vCPU and RAM every hour it exists, whether it is running or stopped. A note under the card says so. If a stopped server is ever priced differently, the card shows Running and Stopped columns instead of one Rate.
Rows marked Not Billed During the Beta are measured but not charged yet. The line under the card gives the date the current rates took effect.
To work out a server’s cost, multiply each rate by the server’s size and the hours in the month. For example, with RAM priced per GB, a server with 2 vCPU and 4 GB of RAM costs 2 times the vCPU rate plus 4 times the RAM rate, per hour. Its volumes and public addresses are added on top. Read your infrastructure usage shows the result for each server.
Read your limits
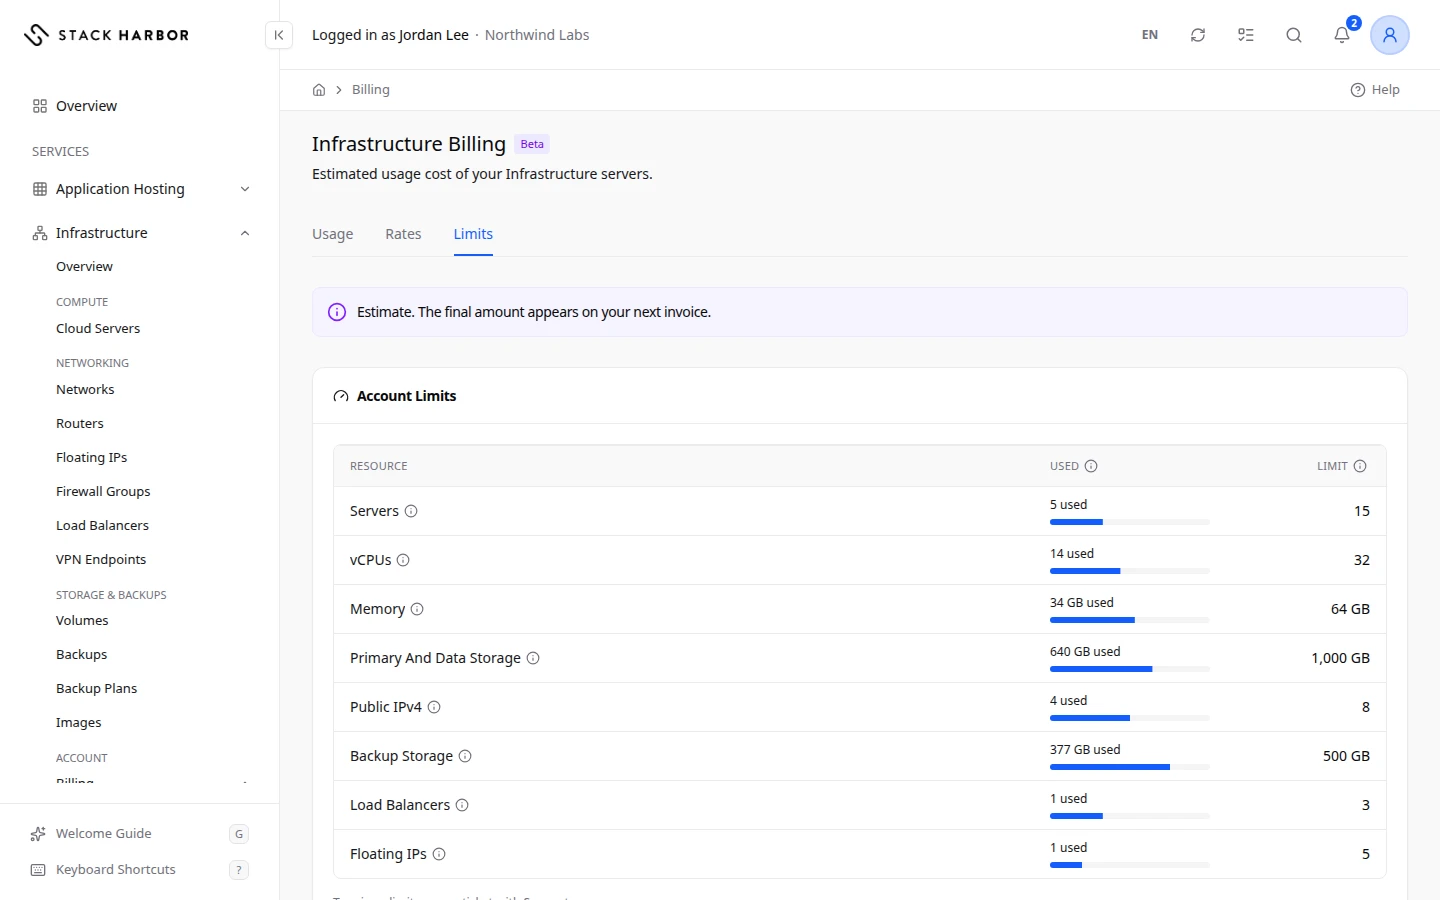
The Account Limits card shows each limit on your account, with how much of it you use. Rows cover Servers, vCPUs, Memory, Primary And Data Storage, Backup Storage, Public IPv4, Public IPv6, Networks, Routers, Firewall Groups, Floating IPs, Load Balancers, VPN Endpoints and VPN Connections.
For each row:
- Used shows how much you use now, for example 3 used. While something is being created, it reads like 3 used, 1 being created.
- Limit shows the most you can have, or No Limit.
- The bar turns amber at 80% of the limit, and red when you are over it. Over appears next to a limit you have passed.
A line under a row can add detail. It may say how many resources were created outside Lighthouse but still count. It may also say that the platform sets a lower limit for your project than your account allows. In that case, the lower one applies.
Managed Resources
On some accounts, a Managed Resources card appears below Account Limits. It lists Load Balancers and VPN Endpoints, with how many are Managed Here and the Limit. It counts only what was made in Lighthouse. These resources aren’t billed.
Raise a limit
To raise a limit, open a ticket with Support. Say which limit you need and how much. See Open a support ticket.
If something goes wrong
- Your limits can’t be shown right now. Try again in a few minutes.
- No rates to show yet. Rates appear once prices are published for your account. Contact support if this lasts.
- The platform’s quota can’t be read right now, so a create may meet a lower limit than this. Your create can still be refused at a lower number.
Fields and statuses
What each item on this page means, what it does and how to read it.
- Resource Column
-
What it is. What is billed.
- Unit Column
-
What it is. How the resource is counted.
How to read it. For example per vCPU per hour or per GB per hour.
- Rate Column
-
What it is. The price for one unit.
How to read it. In your account currency, before tax. Usage is post-billed: you are charged after the month, on your next invoice.
- Stopped Column
-
What it is. The price for one unit while the server is stopped.
How to read it. Shown only when a stopped server is priced differently.
- vCPU Option
-
What it is. One virtual CPU core.
How to read it. Billed per vCPU per hour, running or stopped.
- RAM Option
-
What it is. Server memory.
How to read it. Billed per GB per hour, running or stopped.
- Volume Storage Option
-
What it is. Disk space on volumes, including boot volumes.
How to read it. Billed per GB per hour, attached or not.
- Public IPv4 Option
-
What it is. A public IPv4 address.
How to read it. Billed per address per hour, from allocation until release.
- Backup Storage Option
-
What it is. The space your backups take.
How to read it. Billed per GB per hour.
- Not Billed During the Beta Status
-
What it is. The resource is measured but not charged yet.
- Used Column
-
What it is. How much of the limit you use now.
How to read it. For example 3 used, or 3 used, 1 being created.
- Limit Column
-
What it is. The most you can have.
How to read it. No Limit means there is none. The bar turns amber at 80% and red when you are over.
- No Limit Status
-
What it is. There is no limit on this resource.
- Over Status
-
What it is. You use more than the limit allows.
How to read it. New creates of this kind are refused. Delete some, or open a support ticket to raise the limit.
- Servers Metric
-
What it is. Cloud servers.
How to read it. Shows used against the limit.
- vCPUs Metric
-
What it is. Virtual CPU cores across your servers.
How to read it. Shows used against the limit.
- Memory Metric
-
What it is. Memory across your servers, in GB.
How to read it. Shows used against the limit.
- Primary And Data Storage Metric
-
What it is. Boot and data volume space, in GB.
How to read it. Shows used against the limit.
- Backup Storage Metric
-
What it is. Space your backups take, in GB.
How to read it. Shows used against the limit.
- Public IPv4 Metric
-
What it is. Public IPv4 addresses, including floating IPs and router gateways.
How to read it. Shows used against the limit.
- Public IPv6 Metric
-
What it is. Public IPv6 addresses.
How to read it. Shows used against the limit.
- Networks Metric
-
What it is. Private networks.
How to read it. Shows used against the limit.
- Routers Metric
-
What it is. Routers, including the Default Router.
How to read it. Shows used against the limit.
- Firewall Groups Metric
-
What it is. Firewall groups.
How to read it. Shows used against the limit.
- Floating IPs Metric
-
What it is. Floating IPs.
How to read it. Shows used against the limit.
- Load Balancers Metric
-
What it is. Load balancers on your account.
How to read it. Shows used against the limit.
- VPN Endpoints Metric
-
What it is. VPN endpoints.
How to read it. Shows used against the limit.
- VPN Connections Metric
-
What it is. VPN connections across your endpoints.
How to read it. Shows used against the limit.
- Managed Here Column
-
What it is. How many of these resources were made in Lighthouse.
How to read it. These resources aren’t billed.
- Image Storage Option
-
What it is. The space your private images use: those made from volumes, backups and URLs.
What it does. It is billed per GB per month.
How to read it. The rate is per GB per hour, as the other storage lines.