The Stats tab draws how hard a server works over time. Use it to see whether a server is too small, too big, or busy at a certain hour. The data comes in 5-minute steps and is kept for 30 days.
Open the graphs
- Open the server’s page, then the Stats tab.
- Pick a time range: 1h, 6h, 24h, 7d or 30d, or Custom for your own dates. The default is the last 24 hours.
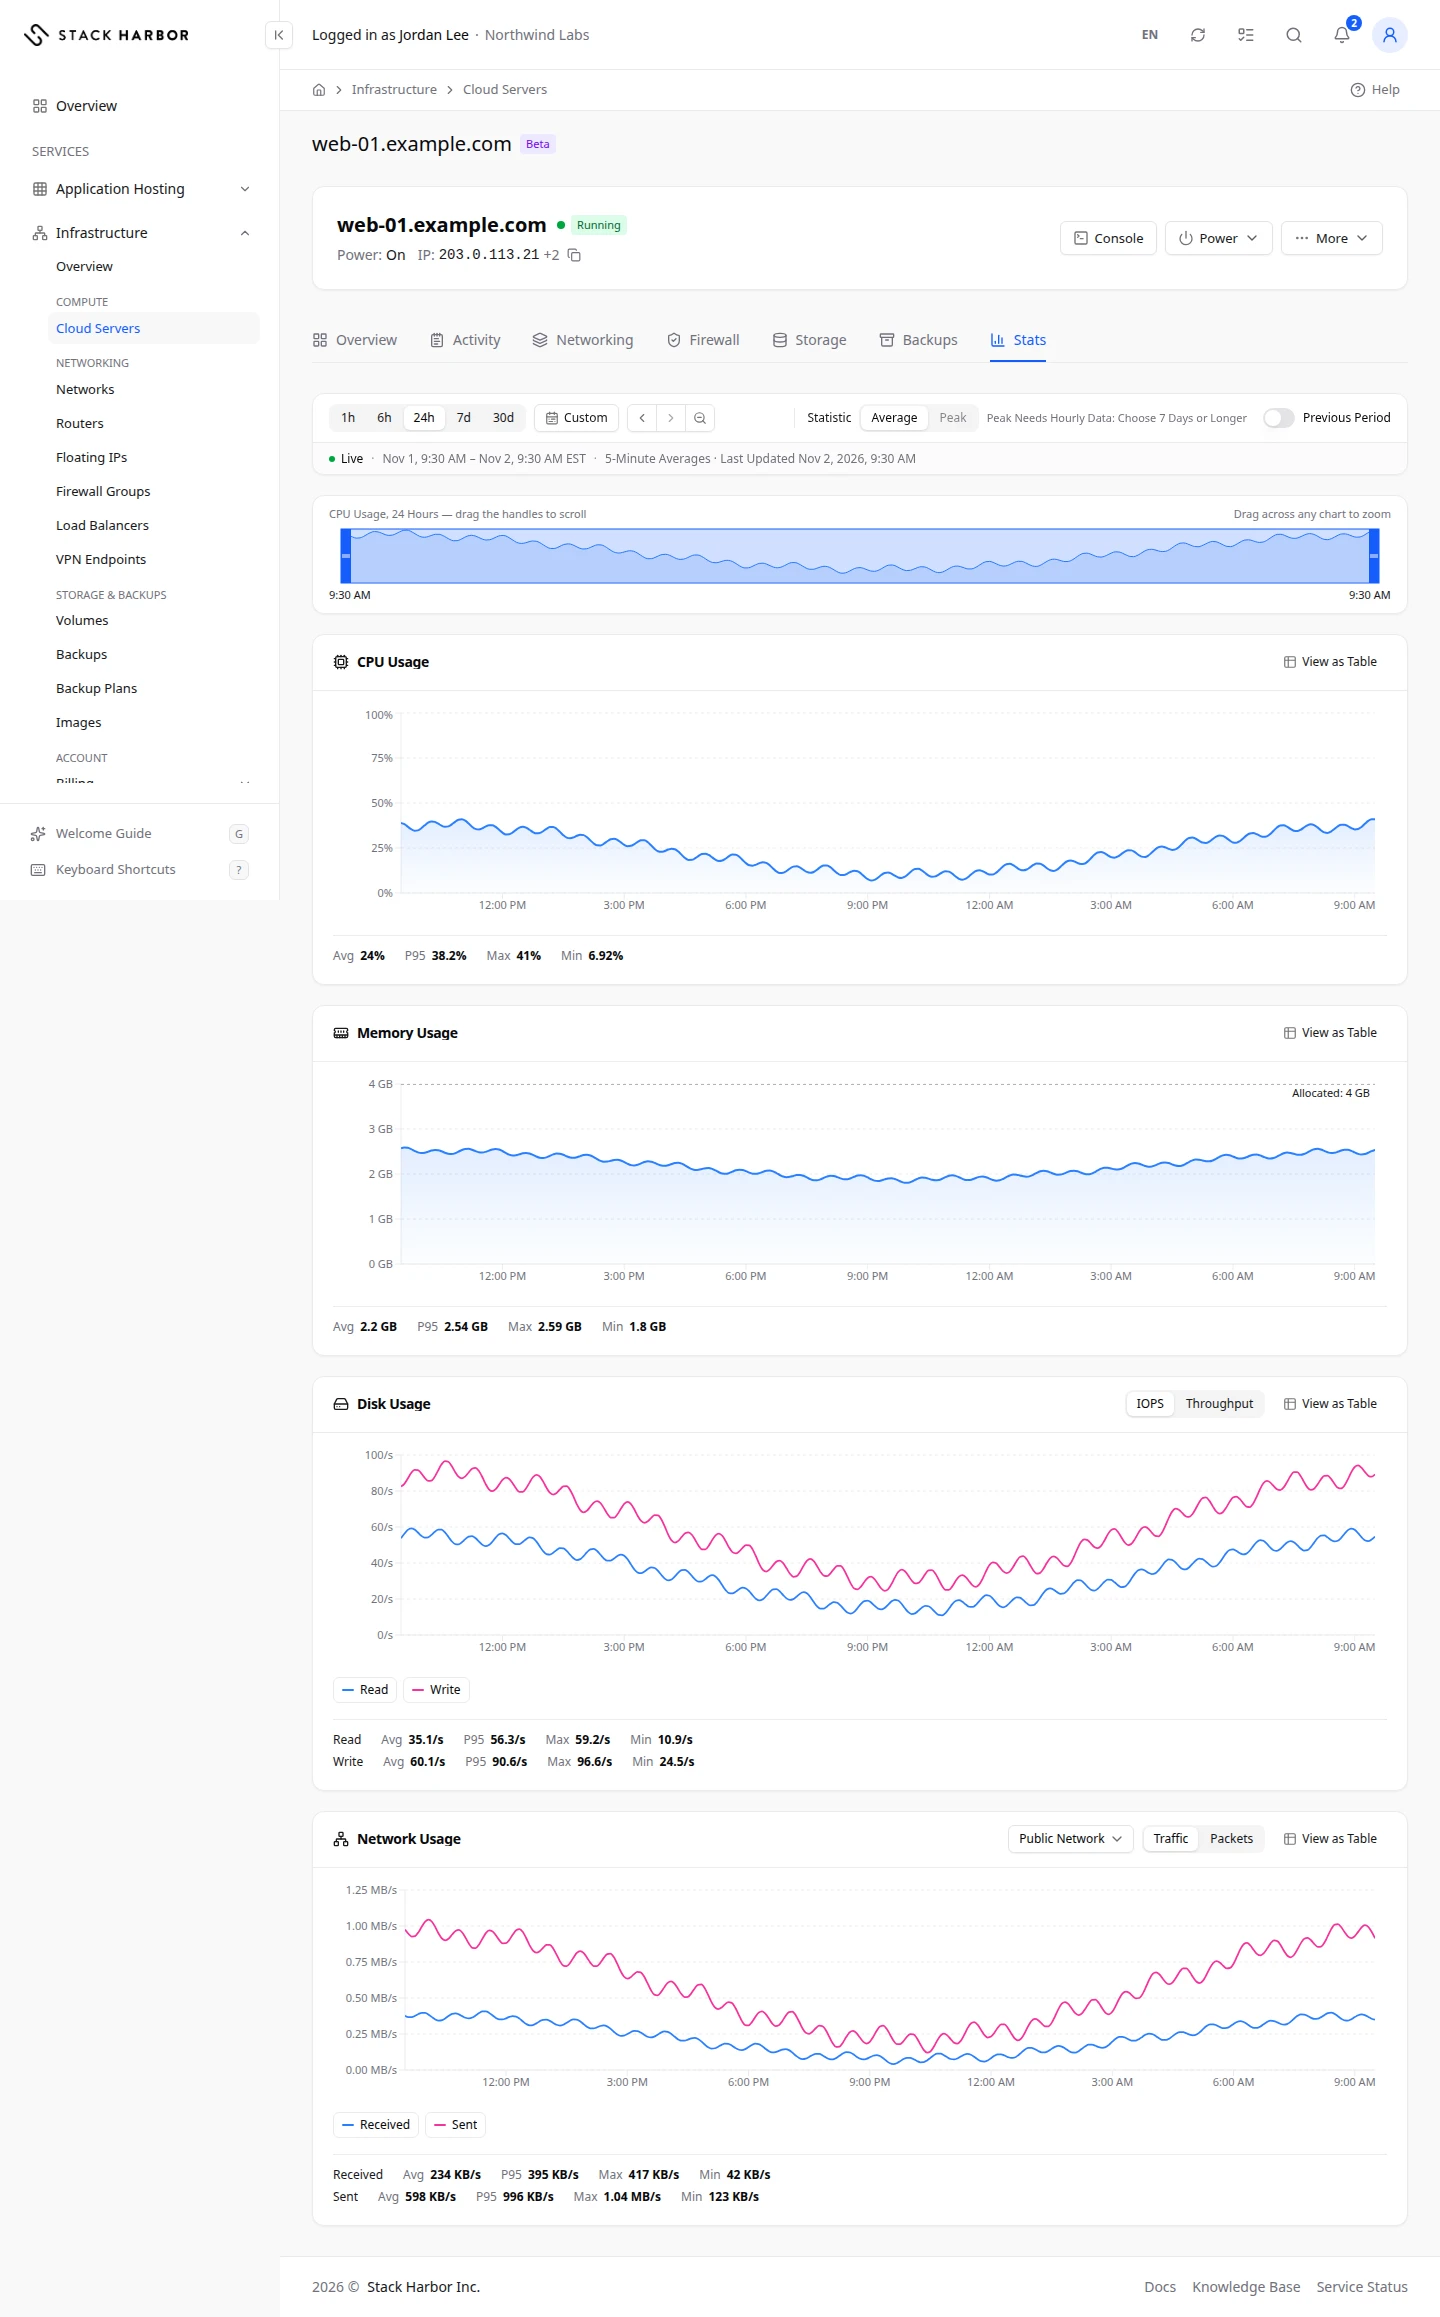
The graphs
- CPU Usage shows the share of the server’s vCPUs in use, in percent, from 0 to 100. Under about 70% most of the time is healthy. A server near 100% for long stretches needs more vCPUs. See Resize or reinstall a server.
- Memory Usage shows Memory Used against the server’s memory, shown as a line marked Allocated. Memory close to the allocated amount for a long time means the server needs more. Some servers don’t share this, and you see This Server Does Not Report Memory Usage.
- Disk Usage shows Read and Write. Switch between IOPS (operations per second) and Throughput (bytes per second).
- Network Usage shows Received and Sent for one interface. Choose the interface in Select Interface. Switch between Traffic (bytes per second) and Packets (packets per second).
Blank stretches are times the server was stopped. Counters Restarted marks a point where the server restarted its counters, for example after a reboot.
Change the view
- Statistic switches between Average and Peak. Peak shows the highest value in each step and needs 7 days or longer.
- Previous Period draws the period before as a second line, to compare.
- Drag across any chart to zoom. Reset Zoom goes back. Earlier and Later move the window.
- View as Table shows the numbers in a table.
Hover over a chart to read the values at one moment on every chart at once.
If something goes wrong
- That selection is too short to show. Drag across a wider stretch.
- The previous period is older than the 30 days the platform keeps.
- If the graphs are empty, the server may have been stopped in that period.
Review the server’s activity
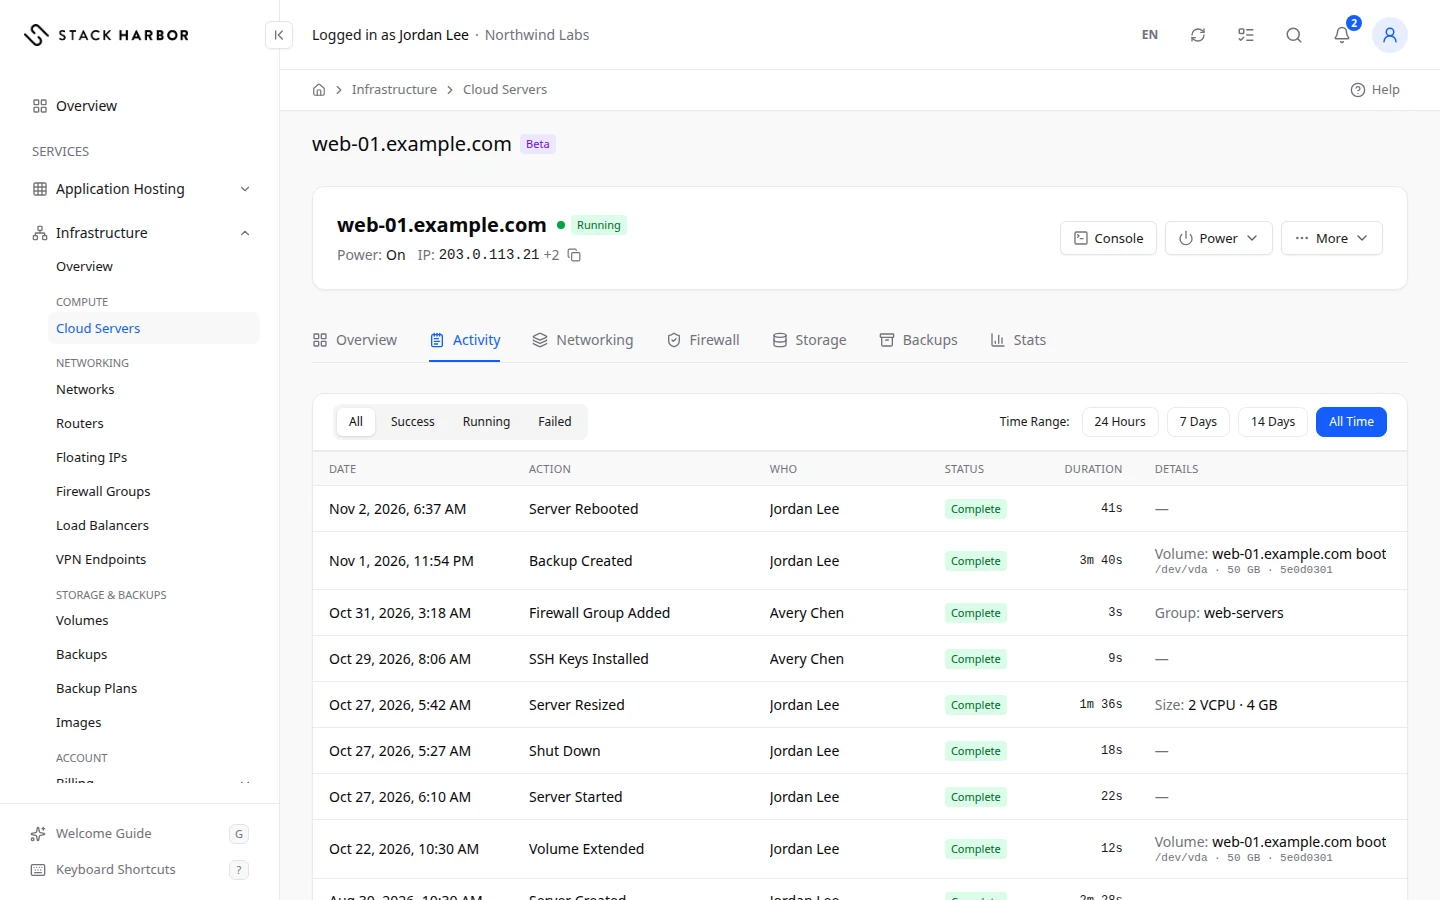
The Activity tab is the history of one server. Every power action, resize, volume change, firewall change, backup and reinstall is listed, newest first. Use it to find out what changed and when.
Read the activity
- Open the server’s page, then the Activity tab.
- Each row shows Date, Action, Who, Status, Duration and Details.
- Action names what happened, for example Server Rebooted, Volume Attached or Firewall Rule Added. Backup actions read Backup Created, Backup Renamed, Backup Restored to a New Volume or Backup Deleted.
- Who is the person who started it. Stack Harbor means the platform or our team did it, for example Platform Maintenance or an Automatic Backup.
- Status says whether it worked.
- Details adds the size, volume, network, address, group, backup or snapshot it touched.
No activity recorded yet. means nothing has happened on the server yet.
A very old server can show This server has a long history: its oldest platform actions may not be listed.
For the whole account’s history, see Review the activity log. For long actions still running, see Track background actions.
Fields and statuses
What each item on this page means, what it does and how to read it.
- 24h Field
-
What it is. The period the graphs cover: 1h, 6h, 24h, 7d, 30d or Custom.
How to read it. The default is the last 24 hours. Data comes in 5-minute steps and is kept for 30 days.
- CPU Usage Metric
-
What it is. The share of the server’s vCPUs in use.
How to read it. In percent, from 0 to 100. Under about 70% most of the time is healthy. Near 100% for long stretches means the server needs more vCPUs.
- Memory Usage Metric
-
What it is. How much of the server’s memory is used, against the allocated amount.
How to read it. In GB. Close to the allocated line for a long time means the server needs more memory.
- Memory Used Metric
-
What it is. The memory the server’s programs are using.
How to read it. In GB. Some servers don’t report it, and the chart says so.
- Disk Usage Metric
-
What it is. How much the server reads from and writes to its disks.
How to read it. Read and Write, as IOPS (operations per second) or Throughput (bytes per second). Steady high values mean the disk is busy.
- IOPS Option
-
What it is. Disk operations per second.
- Throughput Option
-
What it is. Bytes read or written per second.
- Network Usage Metric
-
What it is. How much data one interface receives and sends.
How to read it. Received and Sent, as Traffic (bytes per second) or Packets (packets per second). Choose the interface in Select Interface.
- Traffic Option
-
What it is. Network data in bytes per second.
- Packets Option
-
What it is. Network data in packets per second.
- Counters Restarted Status
-
What it is. The server restarted its counters at this point, for example after a reboot.
How to read it. The values start again from zero. Nothing is wrong.
- Statistic Field
-
What it is. How each 5-minute step is summed up.
How to read it. Average or Peak.
- Average Option
-
What it is. The average value in each step.
- Peak Option
-
What it is. The highest value in each step.
How to read it. Needs a range of 7 days or longer.
- Previous Period Option
-
What it is. Draws the period before as a second line, to compare.
How to read it. The platform keeps 30 days, so older periods can’t be shown.
- Date Column
-
What it is. When the action happened.
How to read it. Newest first.
- Action Column
-
What it is. What happened, for example Server Rebooted or Volume Attached.
- Backup Renamed Option
-
What it is. Someone gave a backup a new name or description.
How to read it. The Details column names the backup.
- Who Column
-
What it is. The person who started the action.
How to read it. Stack Harbor means the platform or our team did it, for example maintenance or an automatic backup.
- Status Column
-
What it is. Whether the action worked.
- Duration Column
-
What it is. How long the action took.
- Details Column
-
What it is. What the action touched, such as a size, volume, network, address, group or backup.