Each monitor has its own page. It shows the monitor’s status now, its history for a time window you choose, and how the check is set up.
Open a monitor
- In the side menu, select Monitoring.
- Select the monitor in the list.
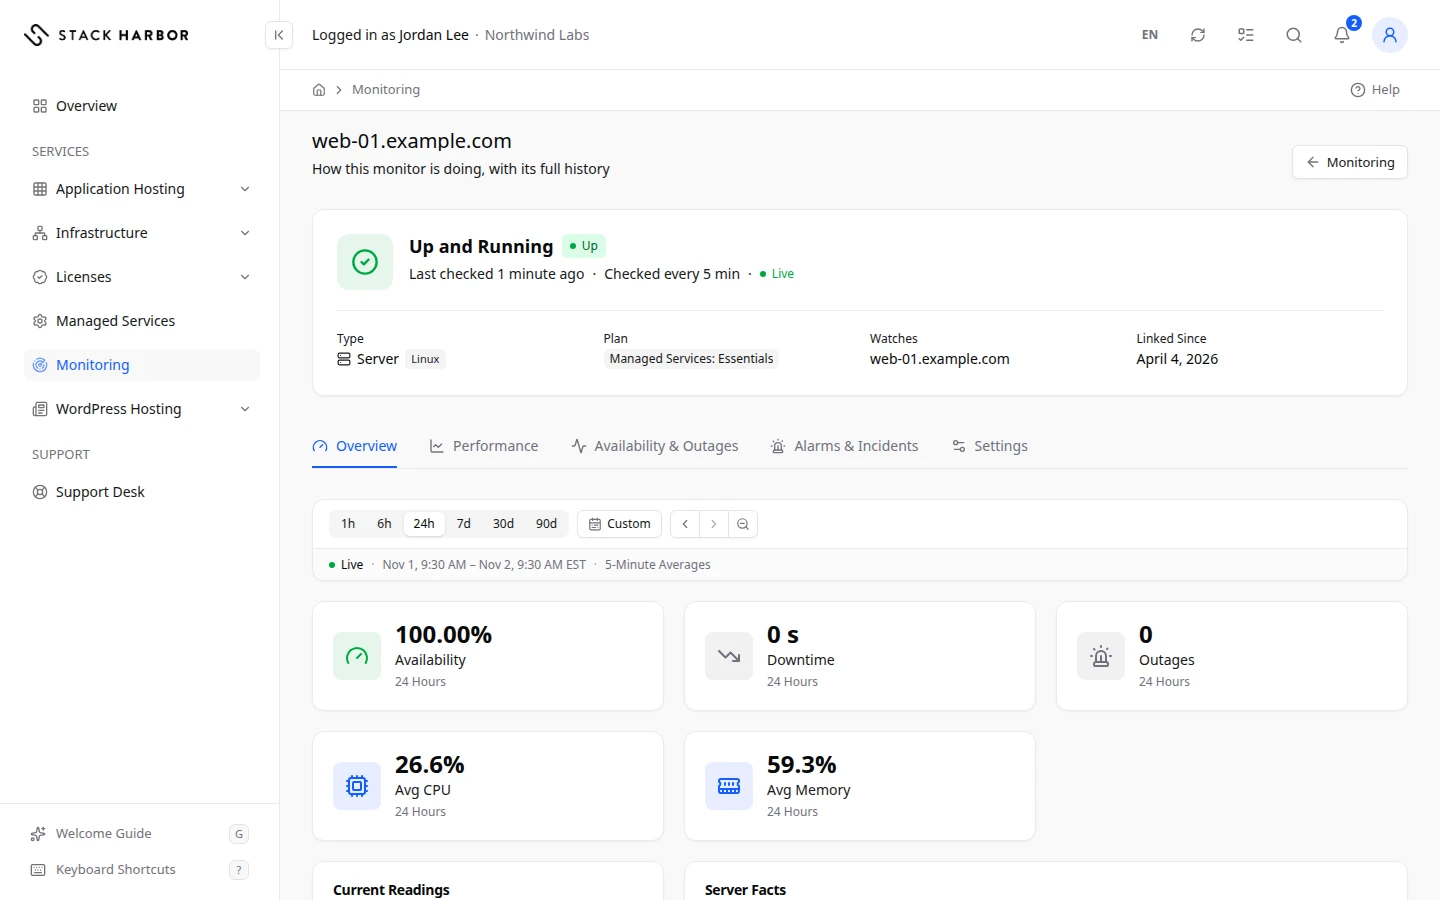
The top of the page states the status in words, for example Up and Running, Down or Status Not Known Yet. It shows how often the monitor checks, for example Checked every 5 min, and when it last checked. If the resource is down, it says since when, for example “Down since 10:42 AM (12 min)”. It also shows the Type, the Plan, what it Watches and the date it was Linked Since.
The tabs are Overview, Performance, Availability & Outages, Alarms & Incidents and Settings. A tab that doesn’t apply to the monitor type is left out. For example, an SSL certificate monitor has no Performance tab.
Choose a time window
Every tab except Settings uses the same time window. The window stays the same when you switch tabs.
- Select a preset at the top: 1 Hour, 6 Hours, 24 Hours, 7 Days, 30 Days or 90 Days. 24 Hours is selected first.
- For other dates, select Custom and pick a start and an end. A window can be from 10 minutes to 365 days long, within the last year.
- To zoom, drag across any chart. Select Reset Zoom to return to the full window.
Live means the window ends now and refreshes. If you moved away from now, Follow Live takes you back.
Overview
- The figure tiles give the Availability in percent, the total Downtime, and the number of Outages in the window. For a server they add Avg CPU and Avg Memory in percent. For a monitor that answers requests they add Avg Response and P95 Response in milliseconds. P95 is the time that 95% of checks were faster than, so it shows the slow end.
- Current Readings shows the latest value of each main figure. Now means it is the live reading. Last Hour Avg means it is the average of the last hour.
- For a server, Server Facts lists its Operating System, Architecture, CPU Cores, Total Memory, Hostname, IP Address, Uptime and number of Processes.
- Small charts show the main figures across the window.
- Recent Alarms lists the last five alarms. Select View All Alarms for the full list.
- For website, ping and DNS monitors, Locations shows the status seen from each place we check from.
A healthy monitor shows availability of 99.95% or better, no ongoing outage, and response times close to their usual level.
Settings
The Settings tab shows how the monitor is set up. You can read it, but only our team can change it.
- Check Interval is how often the check runs.
- Timeout is how long the check waits for an answer before it counts as a failure.
- URL and HTTP Method are the address and method a website or API check uses.
- Hostname and IP Address are the server or host being checked.
- Checked From lists the places the check runs from.
- Alert Thresholds lists the levels that raise an alarm, such as CPU Usage, Memory Usage, Swap Usage, Disk Usage or Partition Usage, and for how many checks in a row.
- Plan and Linked Since say which plan the monitor belongs to and since when.
To change what we monitor or when we alert, select Open a Support Request. The ticket form opens with the plan already chosen.
If something goes wrong
- Monitoring Data Unavailable means we can’t read this monitor’s figures right now. It is about our monitoring service, not your infrastructure. Try again in a few minutes.
- Being prepared… on a tile means the figure is still being calculated. Not measured in this window means there were no readings in the window you chose.
- That selection is too short to show. Drag across a wider stretch. means your zoom was too narrow.
Fields and statuses
What each item on this page means, what it does and how to read it.
- Type Field
-
What it is. The kind of check this monitor runs.
- Plan Field
-
What it is. The Managed Services plan the monitor belongs to.
- Watches Field
-
What it is. The resource or address the monitor checks.
- Linked Since Field
-
What it is. The date the monitor was linked to the plan.
How to read it. The monitor has no history before this date.
- Up and Running Status
-
What it is. The latest check succeeded.
How to read it. Nothing to do.
- Down Status
-
What it is. The resource didn’t answer the latest check.
How to read it. The page says since when. Our team is alerted. Open a ticket if you need more.
- Status Not Known Yet Status
-
What it is. The monitor hasn’t reported a result yet.
How to read it. Wait for the first check.
- 24 Hours Option
-
What it is. The time window the charts and figures cover.
What it does. Choose 1 Hour, 6 Hours, 24 Hours, 7 Days, 30 Days or 90 Days. The window stays when you switch tabs.
How to read it. 24 Hours is selected first.
- Custom Option
-
What it is. A window with your own start and end.
What it does. Pick a start and an end time.
How to read it. From 10 minutes to 365 days long, within the last year.
- Live Status
-
What it is. The window ends now and refreshes on its own.
How to read it. If you moved away from now, Follow Live takes you back.
- Availability Metric
-
What it is. The share of the window the resource was up.
How to read it. Percent. 99.95% or better is healthy.
- Downtime Metric
-
What it is. The total time the resource was down in the window.
How to read it. A duration. Healthy is none.
- Outages Metric
-
What it is. The number of separate outages in the window.
How to read it. A count. 0 is healthy.
- Avg CPU Metric
-
What it is. The server’s average processor use in the window.
How to read it. Percent. Steady use near 100% means no spare capacity.
- Avg Memory Metric
-
What it is. The server’s average memory use in the window.
How to read it. Percent. Close to 100% means the server is short of memory.
- Avg Response Metric
-
What it is. The average time the resource took to answer in the window.
How to read it. Milliseconds. Lower is better. Compare it with its usual level.
- P95 Response Metric
-
What it is. The response time that 95% of checks were faster than.
How to read it. Milliseconds. It shows the slow end. A big gap from the average means some answers are much slower.
- Current Readings Field
-
What it is. The latest value of each main figure.
How to read it. Now means the live reading. Last Hour Avg means the average of the last hour.
- Server Facts Field
-
What it is. Facts about a monitored server: operating system, architecture, CPU cores, total memory, hostname, IP address, uptime and number of processes.
How to read it. Uptime is how long the server has run since its last restart.
- Recent Alarms Field
-
What it is. The last five alarms the monitor raised.
What it does. View All Alarms opens the full list.
- Locations Field
-
What it is. The status seen from each place we check from.
How to read it. For website, ping and DNS monitors.
- Check Interval Field
-
What it is. How often the check runs.
How to read it. A duration, for example every 5 minutes.
- Timeout Field
-
What it is. How long the check waits for an answer before it counts as a failure.
How to read it. A duration.
- URL Field
-
What it is. The address a website or API check calls.
How to read it. For example https://www.example.com/.
- HTTP Method Field
-
What it is. The request method a website or API check uses, such as GET.
- Checked From Field
-
What it is. The places the check runs from.
How to read it. A resource is reported down overall only when enough places see it down.
- Alert Thresholds Field
-
What it is. The levels that raise an alarm, such as CPU Usage or Disk Usage, and for how many checks in a row.
What it does. Only our team can change them. Open a support request to ask.