A monitor is a check our team runs on one of your resources, such as a server or a website. It tests the resource every few minutes and records whether it answered and how fast. Monitoring lists every monitor linked to your Managed Services plans. It is read-only. Our team sets monitors up and changes them for you.
You need the monitoring permission to open it. The account owner always has it.
Open the list
- In the side menu, under Services, select Monitoring.
- The summary card shows how many Monitors you have, with a count per status.
- The table lists one row per monitor. Monitors with a problem are at the top.
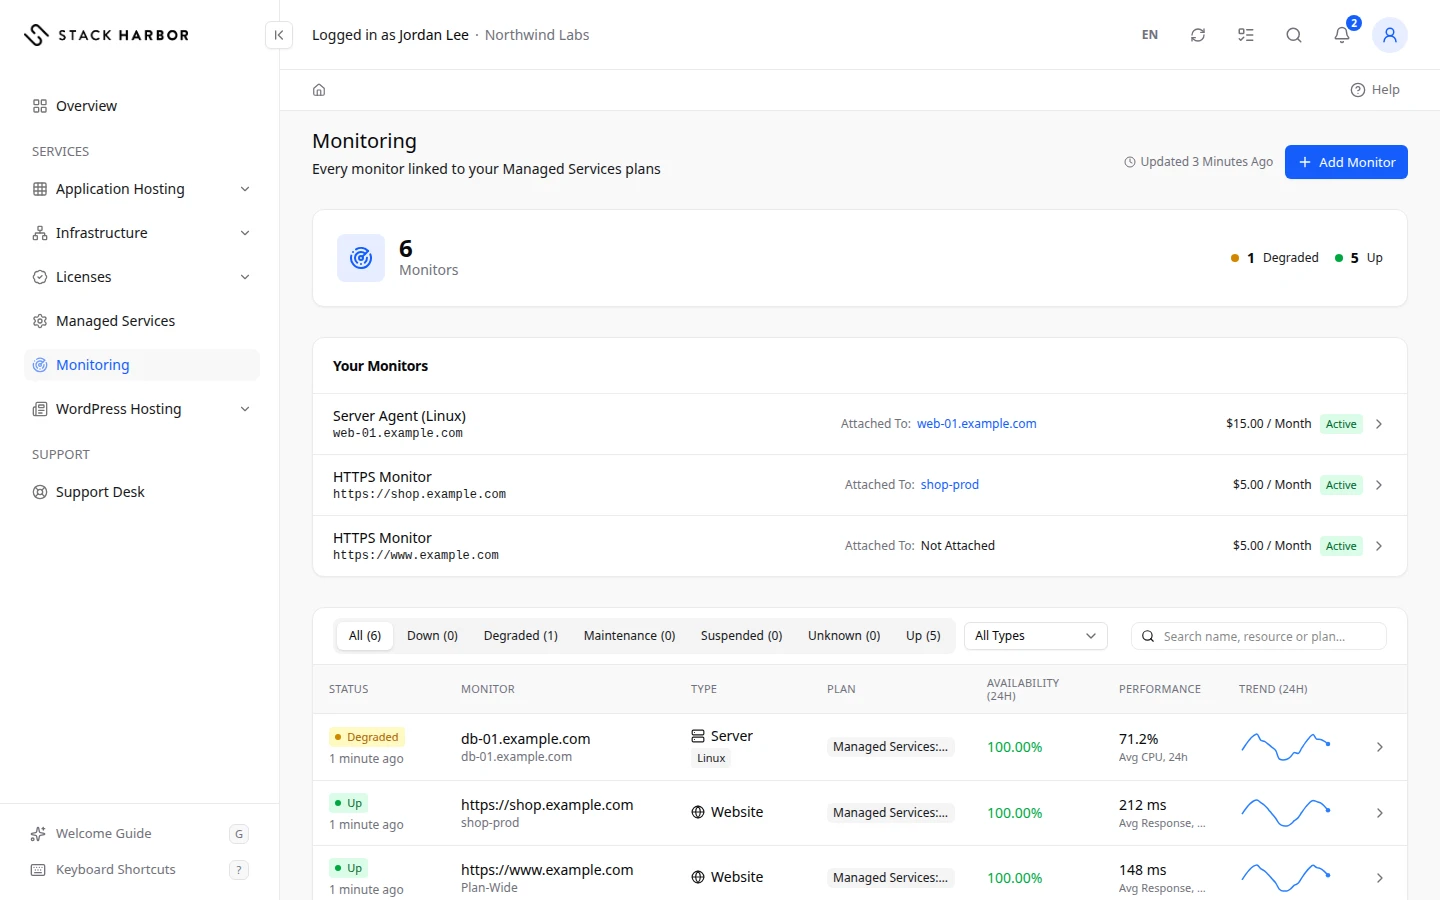
Read a row
- Monitor is the monitor’s name and the resource it watches. Plan-Wide means it watches a whole plan rather than one resource.
- Type is what kind of check it is, such as Server, Website, Ping, DNS, Port, SSL Certificate, Domain Expiry or API.
- Plan is the Managed Services plan the monitor belongs to.
- Status is the result of the latest check, with when it ran.
- Availability (24h) is the share of the last 24 hours the resource was up, as a percentage. It shows in green at 99.95% or better, amber from 99% to 99.95%, and red below 99%.
- Performance is the one figure that matters most for the monitor type. For most monitors it is Avg Response, 24h, the average response time in milliseconds. For a server it is Avg CPU, 24h, the average processor use in percent. Some monitors show Avg Packet Loss, 24h, the share of test packets lost.
- Trend (24h) is a small chart of that same figure over the last 24 hours.
- Last Check is when the monitor last ran.
A dash (—) means there is no figure. Hold the pointer over it to see why, for example Not recorded for this kind of monitor. or No check recorded yet.
Read the status
- Up means the last check succeeded.
- Degraded means the resource answered, but slowly or with part of the check failing.
- Down means the resource didn’t answer the check.
- Maintenance means planned work is in progress, so alerts are paused.
- Suspended means the monitor is paused.
- Unknown means the monitor hasn’t reported yet.
Filter the list
- Choose a status filter, or All.
- Choose a type in All Types, or a plan in All Plans.
- Type in Search name, resource or plan… to find a monitor.
- Select Clear Filters to show everything again.
Select a row to open the monitor. See View a monitor.
If something goes wrong
- No Monitors Linked Yet means none of your plans has a monitor yet. Our team links them. Select Go to Managed Services to see your plans.
- No monitors match these filters. means the filters hide every monitor. Select Clear Filters.
- Monitoring data unavailable. in a banner means we can’t read fresh figures right now. The rows keep their names, and every figure shows a dash until the data is back.
Fields and statuses
What each item on this page means, what it does and how to read it.
- Monitors Metric
-
What it is. How many monitors you have, with a count per status.
How to read it. A count. Monitors with a problem are listed first.
- Monitor Column
-
What it is. The monitor’s name and the resource it watches.
What it does. Select the row to open the monitor.
How to read it. Plan-Wide means it watches a whole plan rather than one resource.
- Type Column
-
What it is. What kind of check the monitor runs.
How to read it. For example Server, Website, Ping, DNS, Port, SSL Certificate, Domain Expiry or API.
- Plan Column
-
What it is. The Managed Services plan the monitor belongs to.
- Status Column
-
What it is. The result of the latest check, with when it ran.
How to read it. Up, Degraded, Down, Maintenance, Suspended or Unknown.
- Availability (24h) Column
-
What it is. The share of the last 24 hours the resource was up.
How to read it. A percentage. Green at 99.95% or better, amber from 99% to 99.95%, red below 99%.
- Performance Column
-
What it is. The figure that matters most for the monitor type, over the last 24 hours.
How to read it. Avg Response, 24h in milliseconds for most monitors, Avg CPU, 24h in percent for a server, or Avg Packet Loss, 24h in percent.
- Trend (24h) Column
-
What it is. A small chart of the Performance figure over the last 24 hours.
How to read it. Look for spikes or a steady climb.
- Last Check Column
-
What it is. When the monitor last ran.
How to read it. A recent time means the monitor is working. No check recorded yet. means it hasn’t run.
- Avg Response, 24h Metric
-
What it is. The average time the resource took to answer over the last 24 hours.
How to read it. Milliseconds. Lower is better. Compare it with its usual level.
- Avg CPU, 24h Metric
-
What it is. The server’s average processor use over the last 24 hours.
How to read it. Percent. Steady use near 100% means no spare capacity.
- Avg Packet Loss, 24h Metric
-
What it is. The share of test packets lost over the last 24 hours.
How to read it. Percent. 0% is healthy.
- Search name, resource or plan… Field
-
What it is. A search box for the monitor list.
What it does. It keeps only the monitors whose name, resource or plan matches what you type.
- All Types Field
-
What it is. A filter for the monitor type.
What it does. It keeps only the monitors of the type you choose.
- All Plans Field
-
What it is. A filter for the Managed Services plan.
What it does. It keeps only the monitors of the plan you choose.
- Up Status
-
What it is. The last check succeeded.
How to read it. Green. Nothing to do.
- Degraded Status
-
What it is. The resource answered, but slowly or with part of the check failing.
How to read it. Amber. Our team is alerted. Open the monitor to see which figure changed.
- Down Status
-
What it is. The resource didn’t answer the check.
How to read it. Red. Our team is alerted. Open the monitor for details, or open a ticket.
- Maintenance Status
-
What it is. Planned work is in progress, so alerts are paused.
How to read it. Blue. Alerts resume when the work ends.
- Suspended Status
-
What it is. The monitor is paused.
How to read it. No new checks run until it restarts. Contact support to ask why.
- Unknown Status
-
What it is. The monitor hasn’t reported yet.
How to read it. Wait for the first check.
- Server Option
-
What it is. Checks a server from the inside: CPU, memory, disk and processes.
- Website Option
-
What it is. Loads a web address and checks that it answers.
- Ping Option
-
What it is. Sends test packets to a host and measures how many come back and how fast.
- DNS Option
-
What it is. Checks that a domain name resolves.
- Port Option
-
What it is. Checks that a network port on a host accepts connections.
- SSL Certificate Option
-
What it is. Watches a website’s certificate and its expiry date.
- Domain Expiry Option
-
What it is. Watches when a domain name registration expires.
- API Option
-
What it is. Calls an API address and checks the answer.