Two tabs tell you when a resource had trouble. Availability & Outages shows how much of the window it was up and lists each outage. Alarms & Incidents lists every alarm the monitor raised and any incident our team recorded.
Availability & Outages
- Open the monitor from Monitoring.
- Select Availability & Outages.
- Choose the time window at the top.
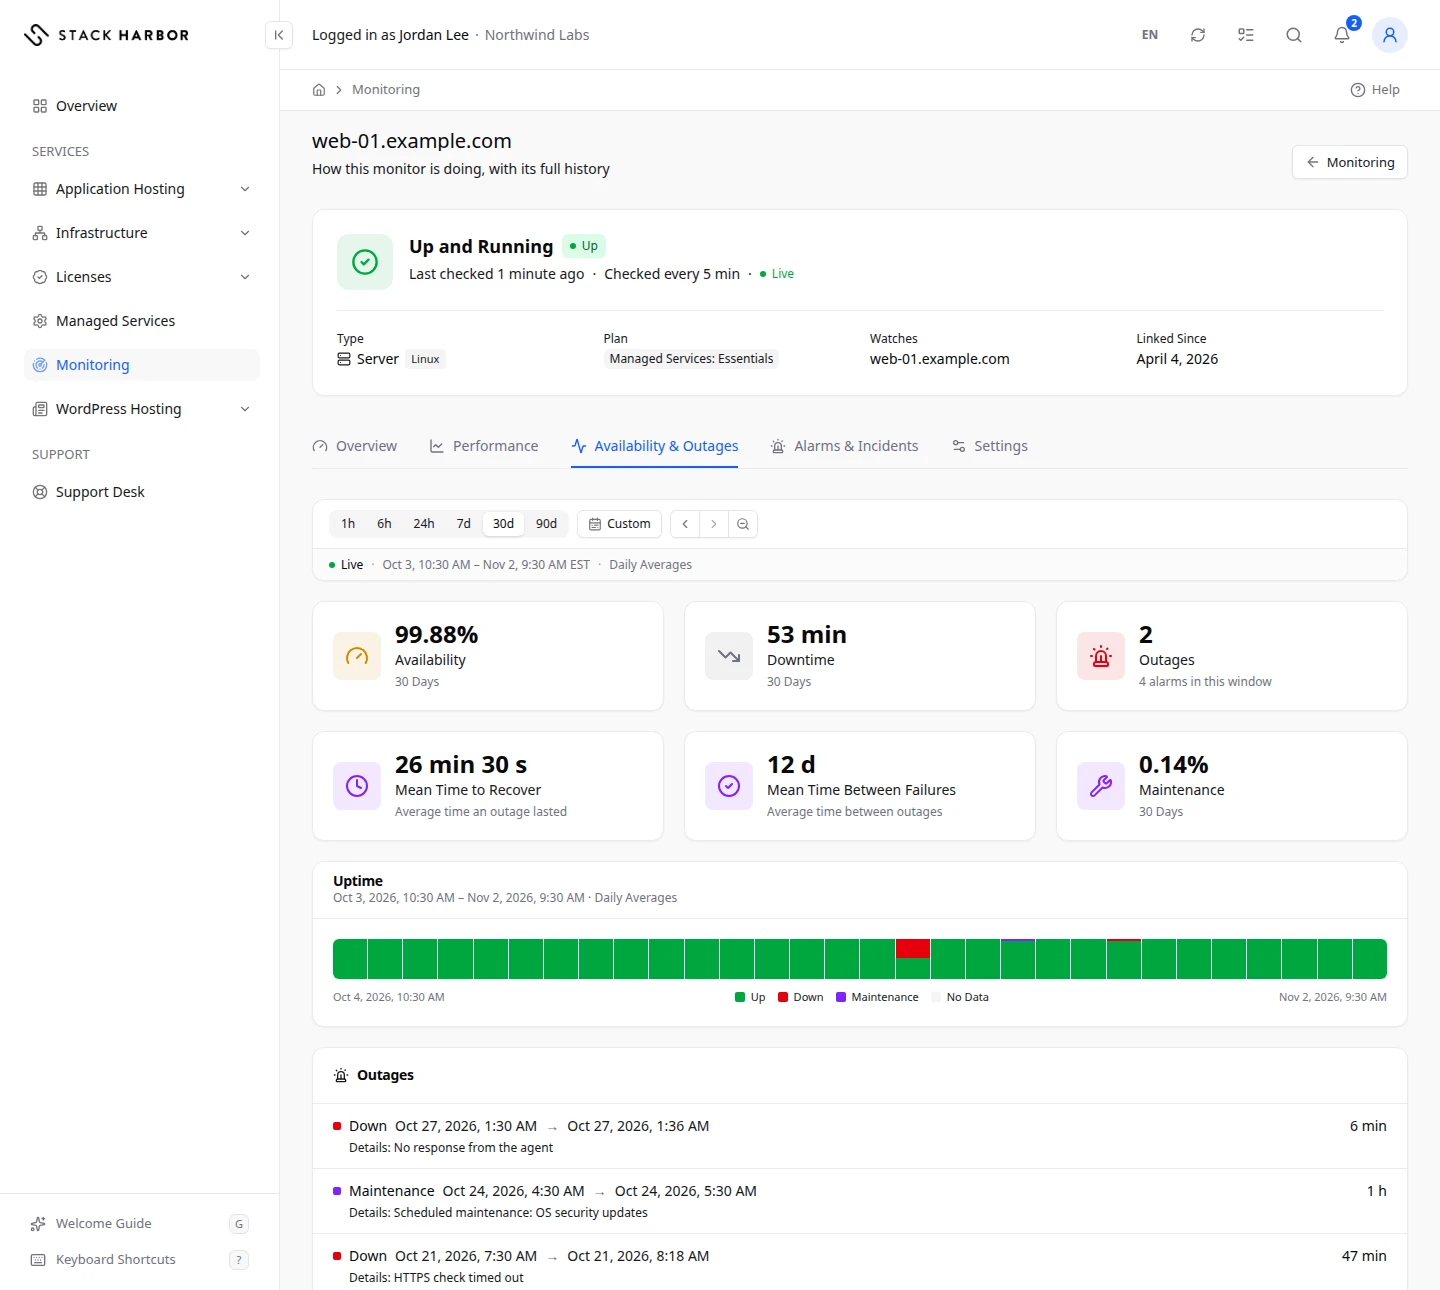
The figures for the window are:
- Availability, the share of time the resource was up, in percent. 99.95% or better is healthy.
- Downtime, the total time it was down.
- Outages, the number of separate outages.
- Mean Time to Recover, the average length of an outage. Shorter is better.
- Mean Time Between Failures, the average time between two outages. Longer is better.
- Maintenance, the time spent in planned maintenance. It isn’t counted as downtime.
The Uptime bar has one column per slice of time, coloured for up, down, maintenance or no data. Availability by Location shows how each checking place saw the monitor. A monitor is reported down overall only when enough places see it down, so one place can show downtime while overall availability stays high.
The outage list shows each down or maintenance period, newest first, with its start, end, duration and the reason as Details. Ongoing means it hasn’t ended. No outages or maintenance in this period. means there were none.
Alarms & Incidents
- Select Alarms & Incidents.
- Choose an alarm type, or All. The types are Down, Critical, Trouble and Maintenance.
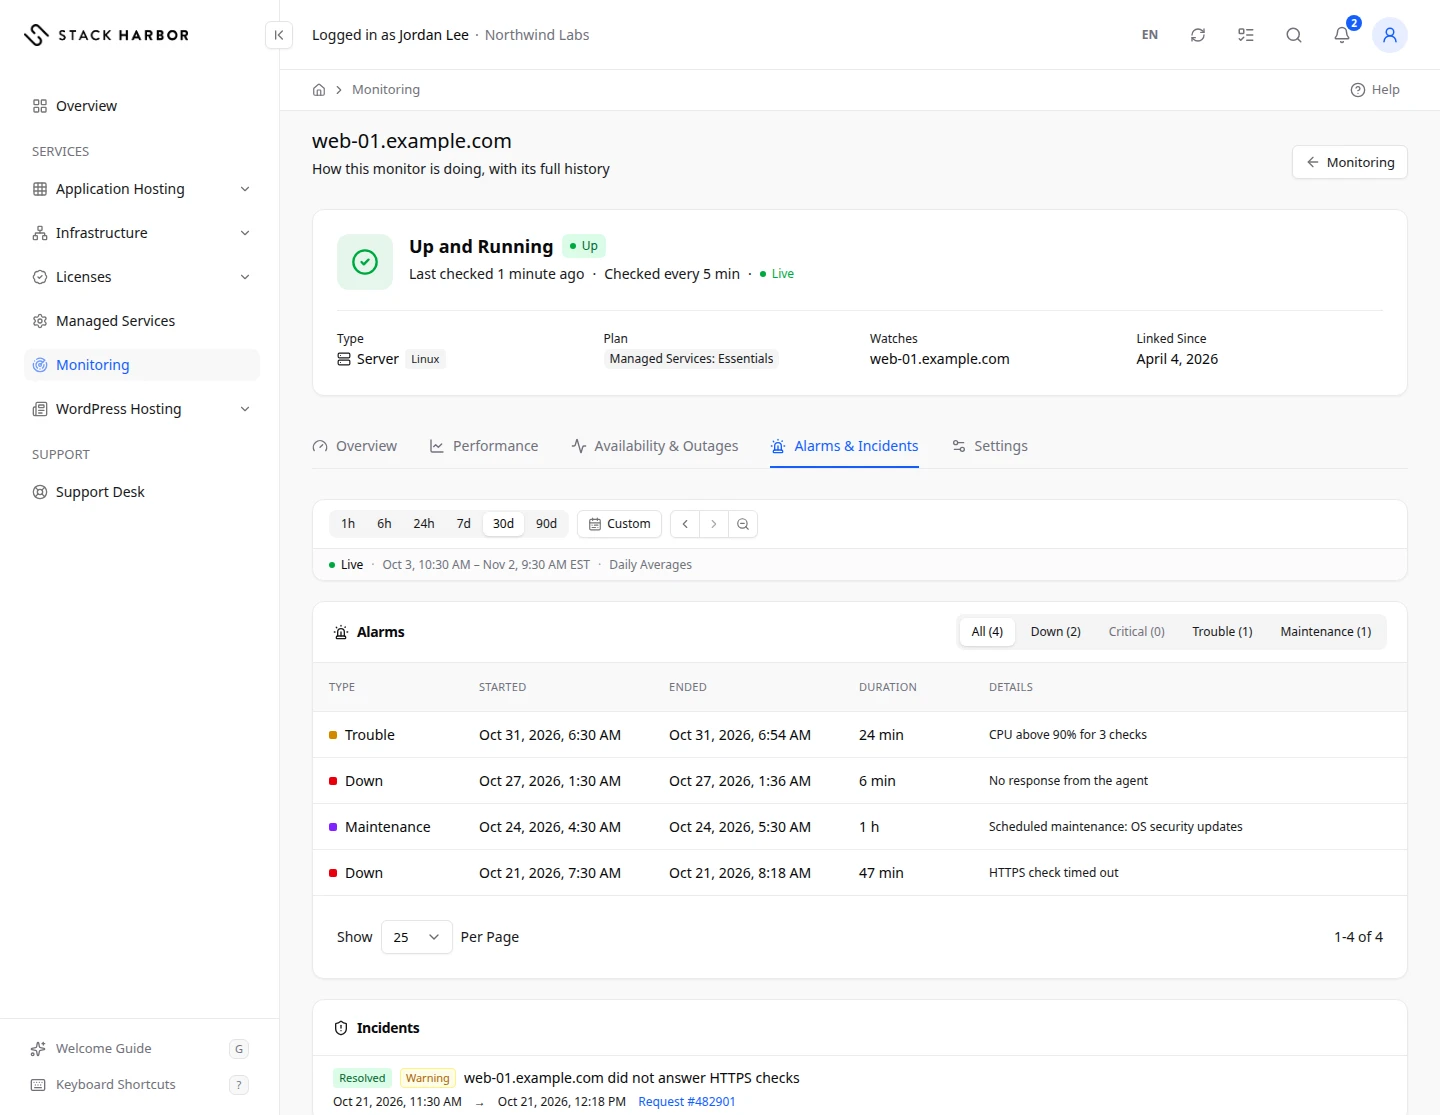
Each alarm shows its Type, when it Started and Ended, its Duration and Details.
- Down means the resource didn’t answer the check.
- Trouble means the resource still answers, but a check crossed a warning threshold, such as slow responses or high usage.
- Critical means the resource still answers, but a check crossed a more serious threshold. It is one step worse than Trouble.
- Down means the monitor couldn’t reach the resource at all.
- The Details column gives the monitor’s reason for each alarm.
- Maintenance means planned work was in progress.
Incidents lists the incidents our team recorded for this monitor. Each shows its severity (Critical, Warning or Info), its state (Open, Acknowledged or Resolved) and the support request it became, for example “Request #4821”. (end inferred) means the end time is an estimate.
If something goes wrong
- Availability history isn’t recorded for this kind of monitor. Its alarms are on the Alarms & Incidents tab. appears for certificate and domain expiry monitors.
- Showing the latest 50 alarms in this period; narrow the window to see more. means the list is cut at 50 rows. Choose a shorter window.
- No alarms in this period. means the monitor raised none in the window.
Fields and statuses
What each item on this page means, what it does and how to read it.
- Maintenance Metric
-
What it is. The time spent in planned maintenance in the window.
How to read it. A duration. It isn’t counted as downtime.
- Mean Time to Recover Metric
-
What it is. The average length of an outage.
How to read it. A duration. Shorter is better.
- Mean Time Between Failures Metric
-
What it is. The average time between two outages.
How to read it. A duration. Longer is better.
- Uptime Field
-
What it is. A bar with one column per slice of time.
How to read it. Coloured for up, down, maintenance or no data.
- Availability by Location Field
-
What it is. How each checking place saw the monitor.
How to read it. One place can show downtime while overall availability stays high.
- Type Column
-
What it is. The kind of alarm.
How to read it. Down, Critical, Trouble or Maintenance.
- Started Column
-
What it is. When the alarm began.
- Ended Column
-
What it is. When the alarm ended.
How to read it. Ongoing means it hasn’t ended.
- Duration Column
-
What it is. How long the alarm lasted.
- Details Column
-
What it is. The reason the monitor gave for the alarm.
- Down Status
-
What it is. The resource didn’t answer the check.
How to read it. Our team is alerted. Open a ticket if it keeps happening.
- Critical Status
-
What it is. The resource still answers, but a check crossed a more serious threshold. It is one step worse than Trouble.
How to read it. Act soon: the Details column names the check. Down, not Critical, means the resource could not be reached.
- Trouble Status
-
What it is. The resource still answers, but a check crossed a warning threshold, such as slow responses or high usage.
How to read it. A warning: look at the Details column for the check and the value.
- Maintenance Status
-
What it is. Planned work was in progress.
How to read it. Nothing to do.
- Critical Status
-
What it is. An incident with the highest severity.
How to read it. Our team handles it first.
- Warning Status
-
What it is. An incident of medium severity.
- Info Status
-
What it is. An incident recorded for information.
- Open Status
-
What it is. The incident is still going on.
How to read it. Our team is on it.
- Acknowledged Status
-
What it is. Our team has seen the incident and is handling it.
- Resolved Status
-
What it is. The incident is over.
How to read it. Nothing to do.