Each load balancer has its own page. It shows where the load balancer answers, how it shares traffic, whether your servers are healthy, and what it costs. Load balancers are in beta. To create one, see Create a load balancer.
Open a load balancer
- In the side menu, open Infrastructure, then select Load Balancers under Networking.
- Select the load balancer’s name. The Load Balancer page opens.
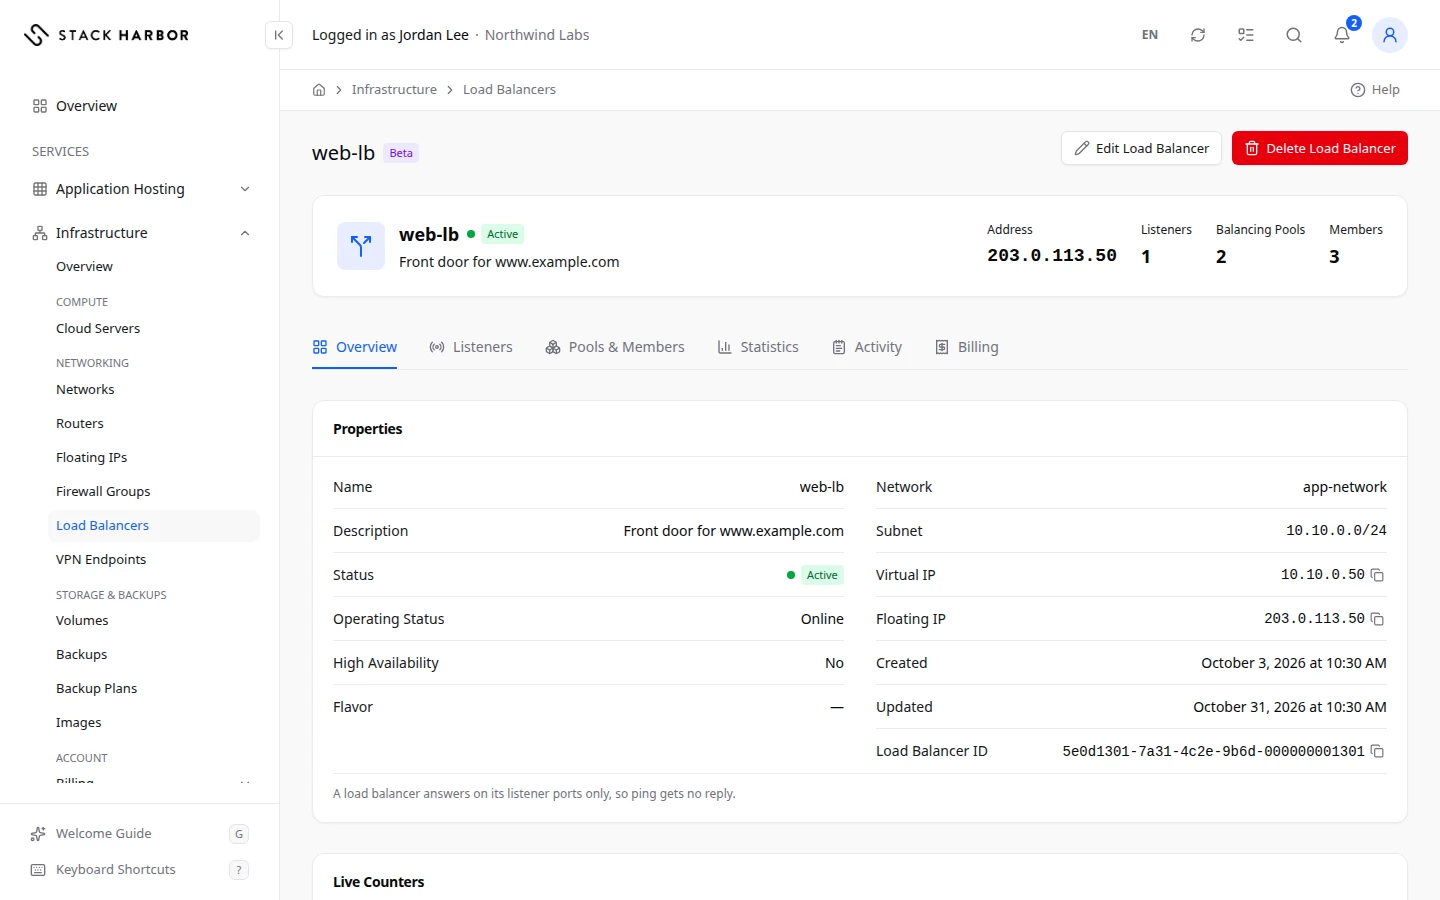
The top card shows its name, status and four figures: its Address, and how many Listeners, Balancing Pools and Members it has. A Read Only badge means it wasn’t created or adopted in Lighthouse, so it can’t be changed here.
Below the card, the tabs are Overview, Listeners, Pools & Members, Statistics, Activity and Billing.
Overview
Properties lists:
- Name, Description and Status. The status is Provisioning while the load balancer is set up, Active when it’s ready and Error when setup failed.
- Operating Status: the health of the whole load balancer, from its members. Online means all are healthy. Degraded means some are offline. Draining means a member finishes its open connections before it leaves.
- High Availability and Flavor: Active / Standby runs a standby that takes over if the active one fails. Single runs one.
- Network and Subnet: where it sits.
- Virtual IP: the private address it answers on.
- Floating IP: its public address, when it has one.
- Created, Updated and Load Balancer ID.
A private virtual IP can’t be reached from the internet, and the page says so. To reach it from outside, assign a floating IP. See Assign a floating IP. A load balancer answers on its listener ports only, so ping gets no reply.
Live Counters shows figures from the last time the page loaded:
- Active Connections: connections open through it right now.
- Total Connections: every connection since it started counting.
- Data In and Data Out: data received from clients and sent back to them.
- Request Errors: requests it couldn’t complete. Above zero, check the health of the members on Pools & Members.
The totals only grow, and can go back to zero after a failover, when the standby takes over.
Listeners
Listeners lists the ports the load balancer answers on. Each row shows the Listener, its Protocol and Port, its Default Pool, its Connection Limit (No Limit when none is set), its Allowed CIDRs (Anyone when it’s open to all) and its Status.
Add a listener
- On Listeners, select Add Listener.
- Choose the Protocol: HTTP, HTTPS, TCP or UDP. HTTPS passes through: the certificate stays on your servers.
- Type the Port it answers on. Each port can be used once, and UDP ports are separate from the others.
- Optional: a Name, a Connection Limit (empty for no limit) and Allowed CIDRs, the address ranges that may connect, separated by commas. Empty lets everyone connect.
- Choose its Default Pool:
- New Pool makes a pool with it. Choose the Algorithm and Session Persistence, add Members (a Server, or an Address and its Subnet, each with a Port, a Weight and Backup Member), and set its Health Monitor.
- Existing Pool uses a pool of this load balancer that has no listener yet, with the same protocol.
- No Pool adds the listener alone. It can’t answer requests until it has a pool.
- Select Add Listener.
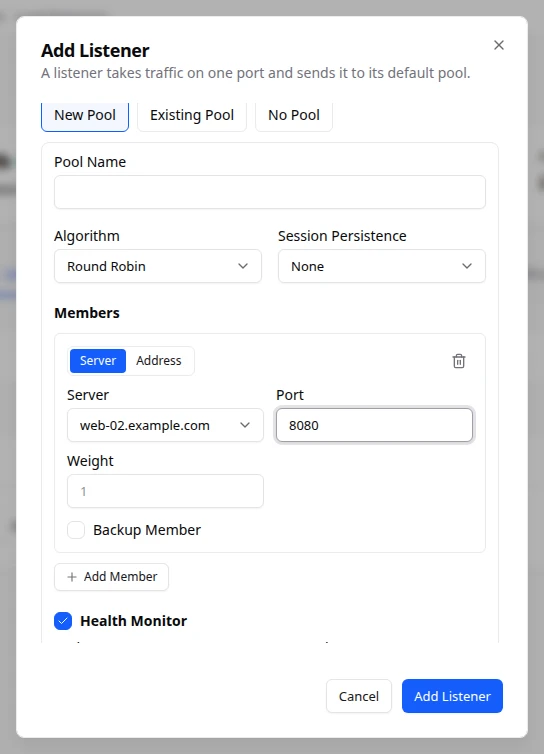
If a server has more than one address, Lighthouse asks Which Address to use. Choose one and select Add Listener again.
The listener is added first. Its pool, then each member, then the health monitor follow, a few seconds each. The page shows Changes in Progress until they finish, and shows each part as it lands.
Edit or delete a listener
- Open the listener’s ⋯ menu and select Edit Listener.
- Change its Name, Connection Limit, Allowed CIDRs or Default Pool. Its protocol and port are Set at creation and can’t change.
- Select Save.
To delete one, open its ⋯ menu, select Delete Listener, then confirm. Traffic on its port stops at once. Its pool stays. If no other listener uses that pool, Lighthouse offers to delete it too. Select Delete Pool, or Cancel to keep it.
Pools & Members
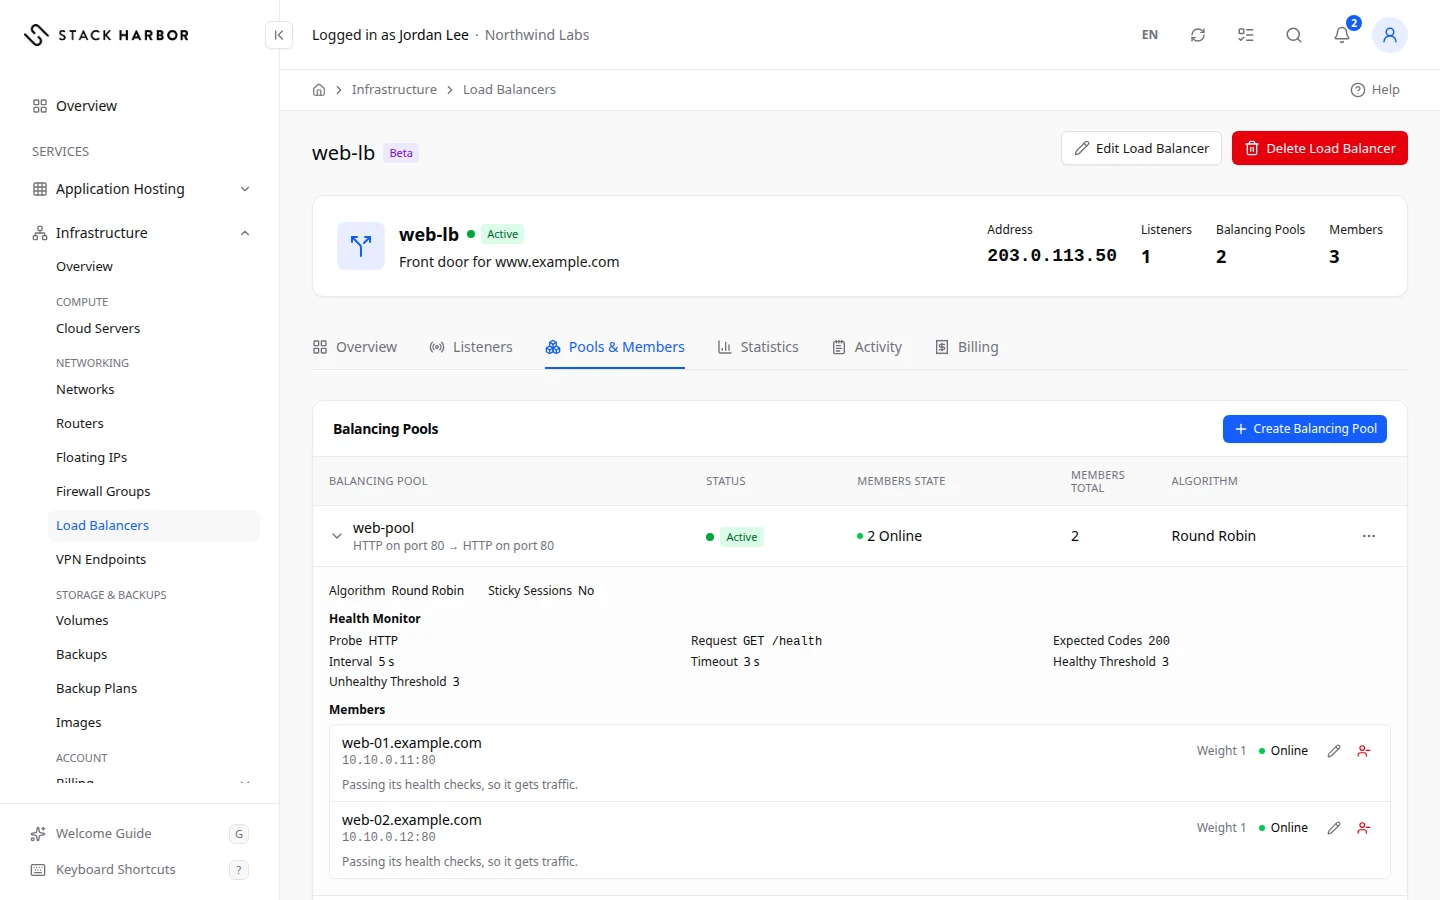
Balancing Pools lists each pool with its Status, Members State and Members Total. Members State counts members by health, for example 2 Online. No Members: Requests Will Fail means the pool has no server to send traffic to.
Select a pool to open it. It shows its Algorithm, whether Sticky Sessions are on, its Health Monitor and its Members. Each member shows its address, its weight (for example Weight 1) and Backup for a member that only gets traffic when the others fail.
Each member’s health is one of:
- Online: passing its health checks, so it gets traffic.
- Error: failing its health checks, so it gets no traffic until it passes again.
- Offline: switched off or unreachable, so it gets no traffic.
- No Health Check: the pool has no health check, so traffic is sent without checking the server answers.
- Unknown: the platform hasn’t reported this member’s health yet.
Create a balancing pool
- On Pools & Members, select Create Balancing Pool.
- Type a Pool Name and choose its Protocol.
- Optional: choose a Listener that has no pool yet to send this pool its traffic. None for now lets you add it to a listener later.
- Choose the Algorithm and Session Persistence. Application Cookie needs the Cookie Name your application sets.
- Add Members and set the Health Monitor, as in Add a listener.
- Select Create Balancing Pool.
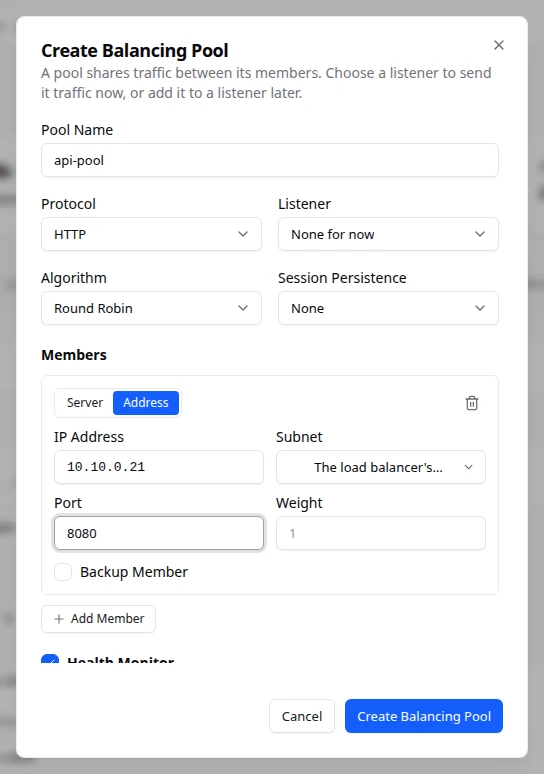
The pool is made first, then each member, then the health monitor. If one of them fails, the page names it and what was made stays. Finish with Add Member or Edit Health Monitor.
Change a pool
Open the pool’s ⋯ menu:
- Edit Pool changes its name, Algorithm and Session Persistence. Its protocol and listener are Set at creation.
- Add Member adds a server, or an address and its subnet, with its Port, Weight and Backup Member. If the server has more than one address, choose Which Address.
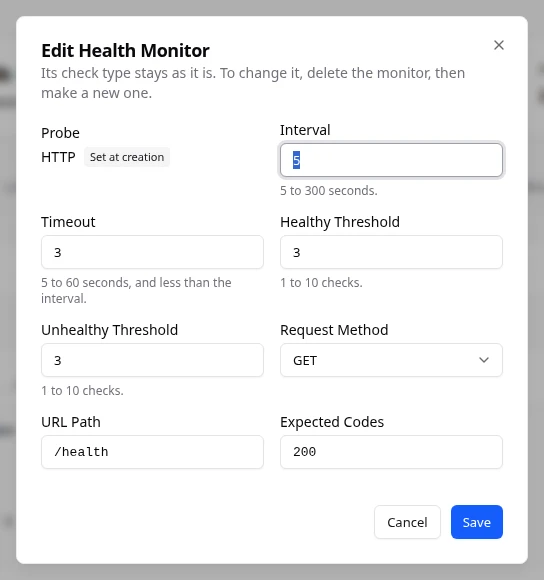
- Edit Health Monitor sets the check: its interval of 5 to 300 seconds, its timeout of 5 to 60 seconds and less than the interval, and its healthy and unhealthy thresholds of 1 to 10. For HTTP and HTTPS, also the Request Method, URL Path and Expected Codes. Once made, its check type can’t change: delete it, then make a new one.
- Delete Health Monitor stops the checks. Traffic is then sent without checking that servers answer.
- Delete Pool deletes it with its members and health monitor. A pool that is still a listener’s default pool can’t be deleted: change or delete that listener first.
Beside each member, the pencil opens Edit Member (its name, Weight and Backup Member; a weight of 0 sends it no new connections). The other button removes it from the pool. The server itself isn’t touched.
Statistics
Statistics shows the traffic history in three charts: Traffic (data per second, In and Out), New Connections and Active Connections.
- Choose a period: 1 hour, 24 hours, 7 days or 30 days, or a custom range.
- Hold the pointer over a chart to read a point. Each point is the average over its 5 minutes, or its hour on 7 and 30 days.
A break in a line is a stretch with no sample, never zero traffic. A shaded band marks Counters reset (failover). Samples are taken every 5 minutes, so the first points appear about 10 minutes after collection begins.
Activity
Activity lists the background actions for this load balancer, such as its creation or an edit, newest first. Select Load Older Actions to see more. Every action of the account is on the Background Actions page. See Track background actions.
Billing
Charges This Month lists what this load balancer costs, with the Item, its price Per Hour and its total Month to Date. Only its public IP is charged today. The load balancer itself and its traffic aren’t itemised in billing yet. Select View Infrastructure Billing for the whole account. See Read your infrastructure usage.
Edit a load balancer
- Select Edit Load Balancer.
- Change the Name or Description.
- Select Save. You see Load balancer updated.
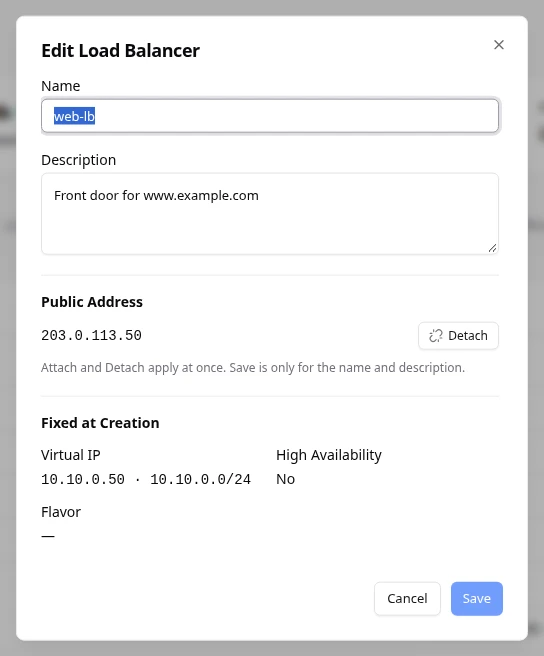
Under Public Address you can attach or detach a floating IP:
- To attach one, choose a free Floating IP, then select Attach.
- To take it off, select Detach.
Attach and Detach apply at once, without Save. To get a floating IP first, see Assign a floating IP. The floating IP’s own page and the Floating IPs list then show Load Balancer: and its name.
Fixed at Creation lists what was set when the load balancer was created: its Virtual IP, High Availability and Flavor. To change one, create a new load balancer.
Delete a load balancer
- Select Delete Load Balancer.
- Type its name to confirm, for example
web-lb. - Select Delete Load Balancer.
You see Deleting web-lb., then web-lb is deleted. It is removed with its listeners, pools and health monitors. Traffic stops reaching your servers through it, but the servers aren’t touched. Its public address is released, and you may not get the same one back.
If something goes wrong
- Edit Load Balancer and Delete Load Balancer are greyed out while it is busy: The load balancer is busy with another change. Try again in a moment.
- A change is being applied. You can make another one when it finishes. The listener and pool buttons wait until the change in progress ends.
- The load balancer is busy with another change. Lighthouse tries again in a moment, on its own. Keep the window open: your change is sent again once the load balancer is ready.
- Add Listener Didn’t Finish means a part made after the listener couldn’t be made, for example The listener and its pool were made, but member 1 could not be added. What was made stays. Finish it with the control the message names, on Pools & Members.
- Another listener already uses this port. Choose another port.
- That setting was fixed when it was made and can’t be changed.
- This pool is still the default pool of http. Change or delete that listener first.
- The timeout must be 5 to 60 seconds and less than the interval.
- If the network, subnet or router of a load balancer can’t be deleted, its delete names the load balancer that uses it. Delete the load balancer first.
- The public address changed during the delete, so the load balancer wasn’t deleted. Try again.
- Load Balancer Not Found means it was deleted, or the link is wrong. Go back to the list.
- Members in Error or Offline: check that each server is running and listens on the pool’s backend port.
- Changes Are Switched Off means changes are paused for now. You can still read everything.
Fields and statuses
What each item on this page means, what it does and how to read it.
- Operating Status Field
-
What it is. The health of the whole load balancer, summed up from its members.
How to read it. Online is healthy. Degraded means some members are offline.
- Flavor Field
-
What it is. How the load balancer runs.
How to read it. Active / Standby with high availability, or Single.
- Default Pool Column
-
What it is. The pool this listener sends traffic to.
- Connection Limit Column
-
What it is. The most connections the listener accepts at once.
- Allowed CIDRs Column
-
What it is. The address ranges allowed to connect.
How to read it. Empty means anyone.
- Set at creation Field
-
What it is. A setting fixed when the load balancer, listener, pool, member or health monitor was made.
How to read it. It is shown but can't change. To change it, make a new one.
- Public Address Field
-
What it is. The floating IP on the load balancer’s virtual IP, which lets the internet reach it.
What it does. Attach and Detach apply at once.
How to read it. The floating IP’s page shows Load Balancer: and the load balancer’s name.
- Default Pool Field
-
What it is. Where a listener sends its traffic: a new pool made with it, an existing pool with no listener, or none.
What it does. A listener with no pool can't answer requests.
- Session Persistence Field
-
What it is. Whether a client keeps going to the same member.
What it does. Source IP keeps each client address on one member. Load Balancer Cookie lets the load balancer set a cookie. Application Cookie follows a cookie your application sets, by its name.
How to read it. The cookie choices work only on an HTTP pool.
- Expected Codes Field
-
What it is. The HTTP answers that count as healthy.
How to read it. One code (200), a list (200,202) or a range (200-204).
- Which Address Field
-
What it is. The server address the member uses, when the server has more than one.
How to read it. Shown only after Lighthouse asks.
- Members State Column
-
What it is. How the pool’s members are doing.
- Members Total Column
-
What it is. How many members the pool has.
How to read it. A pool with none sends traffic nowhere.
- Online Status
-
What it is. The member passes its health check and receives traffic.
- Offline Status
-
What it is. The member fails its check and gets no traffic until it recovers.
How to read it. Check the server is running and answers on the backend port.
- No Health Check Status
-
What it is. The pool has no health check, so the member always receives traffic.
How to read it. Turn on Check Member Health if you can.
- Error Status
-
What it is. The load balancer can’t reach the member.
How to read it. Check the server is running and listens on the backend port.
- Degraded Status
-
What it is. Some members are offline.
How to read it. Look at each pool’s members to find which.
- Draining Status
-
What it is. A member is finishing its open connections before it leaves.
- Address Metric
-
What it is. The address the load balancer answers on.
How to read it. Its public address when it has one, else its private virtual IP.
- Listeners Metric
-
What it is. How many listeners the load balancer has.
How to read it. A count.
- Balancing Pools Metric
-
What it is. How many balancing pools it has.
How to read it. A count.
- Members Metric
-
What it is. How many servers its pools send traffic to, in total.
How to read it. A count. 0 means requests will fail.
- Description Field
-
What it is. Your note about what the load balancer is for.
What it does. Edit Load Balancer changes it.
- High Availability Field
-
What it is. Whether a standby copy runs beside the active one.
How to read it. Yes means a standby takes over if the active one fails. It can’t be changed after creation.
- Active / Standby Option
-
What it is. Runs an active load balancer and a standby.
What it does. The standby takes over if the active one fails.
- Single Option
-
What it is. Runs one load balancer, with no standby.
- Subnet Field
-
What it is. The address range its virtual IP comes from.
- Virtual IP Field
-
What it is. The private address the load balancer answers on.
What it does. The copy icon copies it.
How to read it. It can’t be reached from the internet. Assign a floating IP for that.
- Floating IP Field
-
What it is. The public address of the load balancer, when it has one.
What it does. The copy icon copies it.
How to read it. It is billed like any floating IP, and released when you delete the load balancer.
- Created Field
-
What it is. When the load balancer was created.
How to read it. In your time zone.
- Updated Field
-
What it is. When it last changed.
How to read it. In your time zone.
- Load Balancer ID Field
-
What it is. The load balancer’s unique identifier.
What it does. The copy icon copies it.
How to read it. Give it to support when you ask about this load balancer.
- Active Connections Metric
-
What it is. Connections open through the load balancer right now.
How to read it. A count from the last time the page loaded. A steady climb with flat traffic can mean clients aren’t closing connections.
- Total Connections Metric
-
What it is. Every connection made since the load balancer started counting.
How to read it. A count that only grows. It can go back to zero after a failover.
- Data In Metric
-
What it is. All data received from clients since the load balancer started counting.
How to read it. In bytes, shown in KB, MB or GB. It can go back to zero after a failover.
- Data Out Metric
-
What it is. All data sent back to clients since the load balancer started counting.
How to read it. In bytes, shown in KB, MB or GB. It can go back to zero after a failover.
- Request Errors Metric
-
What it is. Requests the load balancer couldn’t complete since it started counting.
How to read it. 0 is healthy. Above zero, check the health of the members on Pools & Members.
- Listener Column
-
What it is. The name of the listener.
- Protocol Column
-
What it is. The protocol the listener answers, such as HTTP or TCP.
- Port Column
-
What it is. The port the listener answers on, for example 80.
- Status Column
-
What it is. The state of the listener.
How to read it. Active when it accepts traffic.
- Balancing Pool Column
-
What it is. The pool, by its rule, for example HTTP on port 80.
What it does. Selecting the row opens the pool with its members.
- Status Column
-
What it is. The state of the pool.
- Health Monitor Field
-
What it is. The health check of the pool: its probe, interval, timeout and thresholds.
What it does. A member that fails it gets no traffic until it passes again.
How to read it. No health monitor on this pool. means traffic is sent without checking.
- Weight 1 Field
-
What it is. The member’s share of the traffic.
How to read it. A higher weight gets more traffic than a lower one. 0 sends it none.
- Unknown Status
-
What it is. The platform hasn’t reported this member’s health yet.
How to read it. Wait a moment, then reload the page.
- No Members: Requests Will Fail Status
-
What it is. The pool has no member, so it has no server to send traffic to.
How to read it. Requests through this pool fail. Pools can’t be changed here yet, so contact support.
- Traffic Metric
-
What it is. Data per second through the load balancer: In is what clients send, Out is what goes back.
How to read it. Each point is the average over 5 minutes, or an hour on 7 and 30 days. A break in a line is a stretch with no sample, never zero traffic.
- New Connections Metric
-
What it is. New connections opened per second.
How to read it. Spikes show bursts of visitors or clients reconnecting.
- Active Connections Metric
-
What it is. Connections open at the time of each sample.
How to read it. Many open but few new means long-lived connections.
- Counters reset (failover) Status
-
What it is. The load balancer’s counters went back to zero, usually because the standby took over.
How to read it. Shown as a shaded band on the charts. Nothing to do.
- Item Column
-
What it is. What is charged, such as the Public IP.
How to read it. Only the public IP is charged today.
- Per Hour Column
-
What it is. The hourly price of the item.
How to read it. In your account currency, before tax.
- Month to Date Column
-
What it is. What the item has cost so far this month.
How to read it. In your account currency, before tax. Usage is billed after the month ends.
- Edit Load Balancer Field
-
What it is. Changes the load balancer’s name and description.
What it does. Select Save to keep the change.
How to read it. Greyed out while it is busy.
- Delete Load Balancer Field
-
What it is. Deletes the load balancer.
What it does. Removes it with its listeners, pools and health monitors, and releases its public address. Your servers aren’t touched. You type its name to confirm. This can’t be undone.
How to read it. Greyed out while it is busy.
- Read Only Status
-
What it is. The load balancer wasn’t created or adopted in Lighthouse.
How to read it. It can’t be changed or deleted here.
- Load Balancer Not Found Status
-
What it is. There is no load balancer at this address.
How to read it. It may have been deleted. Go back to the list.