The Monitoring tab of a plan shows how the resources it covers are doing. Our monitors check them from outside and report whether they answer. You need the monitoring permission to see this tab.
Open the health view
- Open the plan from Managed Services.
- Select the Monitoring tab.
- Choose a period: 7 Days, 30 Days or 90 Days.
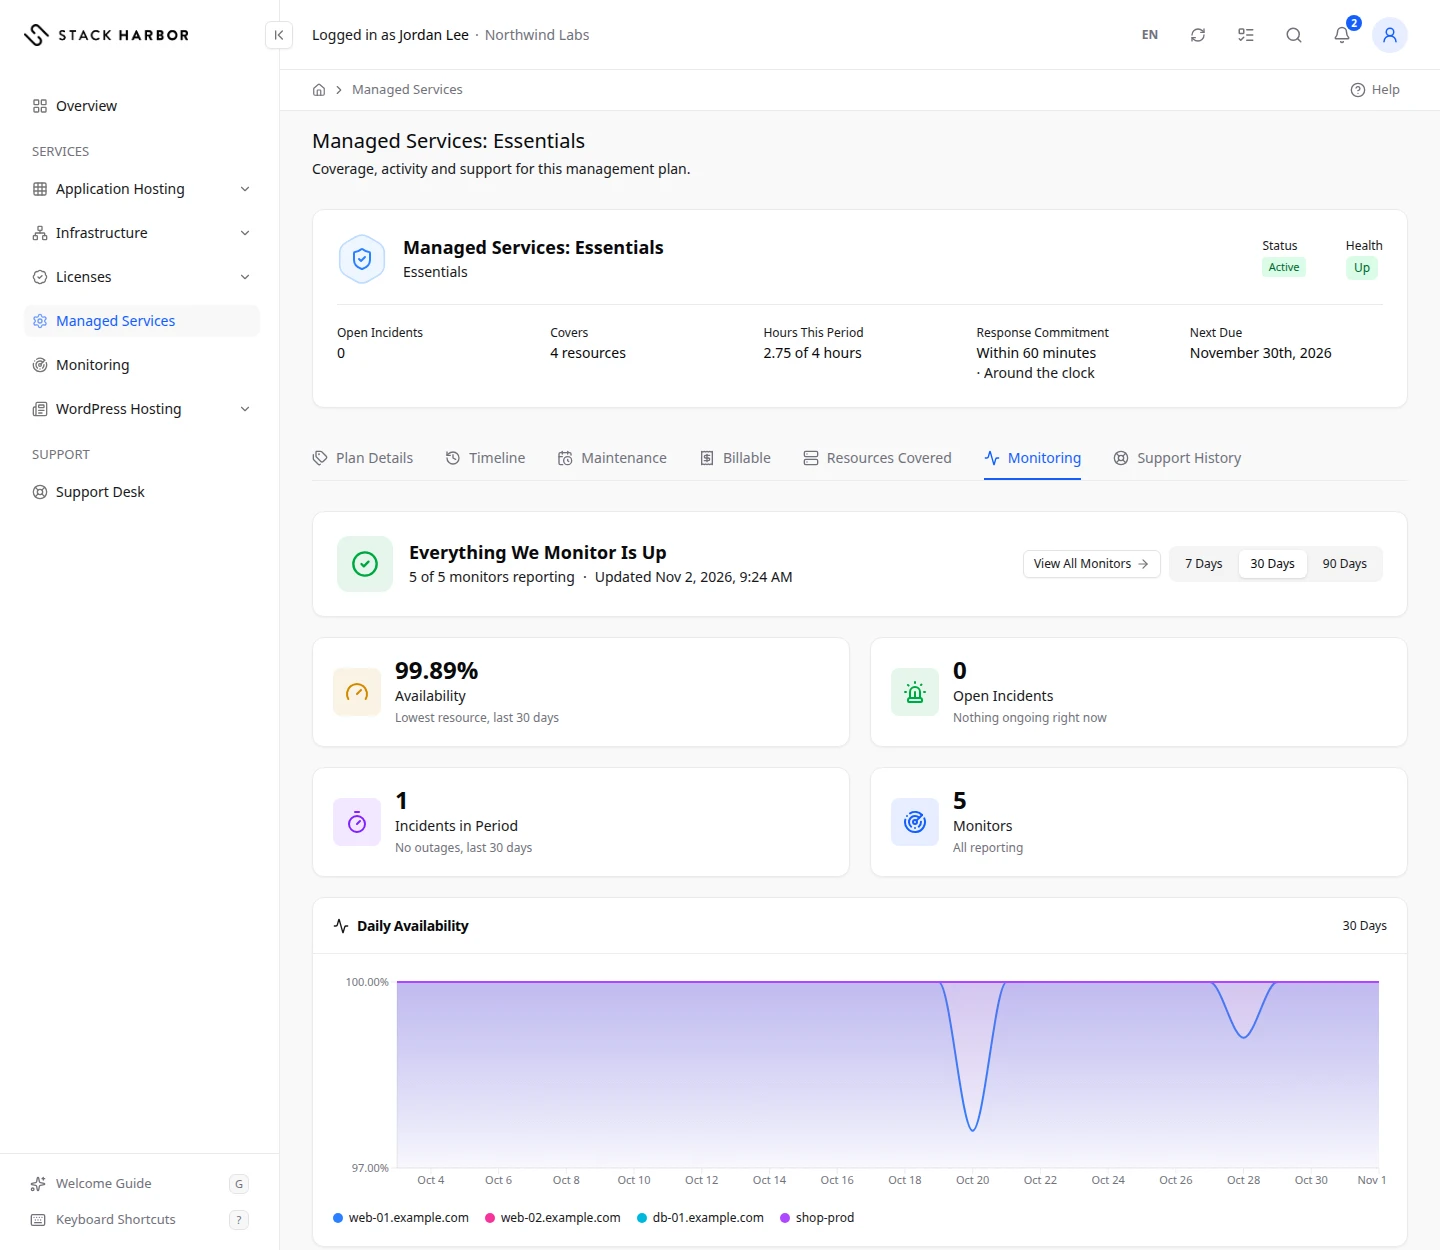
The heading gives the verdict in words, for example Everything We Monitor Is Up or Something We Monitor Is Down. Under it you see how many monitors are reporting, for example “3 of 3 monitors reporting”, and when the readings were last updated.
Read the figures
- Availability is the lowest availability among the plan’s resources for the period, as a percentage. It is the worst resource, not an average. A healthy reading is 99.95% or better.
- Open Incidents is the number of problems still ongoing. Nothing ongoing right now means there are none.
- Incidents in Period is how many incidents started in the period, with how many were outages.
- Monitors is the number of monitors linked to the plan. All reporting means each one sent a recent reading.
Read the charts
- Daily Availability draws each monitored resource’s availability per day. You can choose which resources to chart.
- Availability by Resource has one row per resource. Each row shows its health, its availability, its total downtime (or No downtime), any open outages and a strip with one segment per day.
- The colour key is the same everywhere. Green means 99.95% or Better, amber means 99% to 99.95%, red means Below 99%, and grey means No Data.
- Plan-Wide Monitors are monitors that watch the plan as a whole. They count toward the verdict, but they have no daily breakdown yet.
- Incidents lists each incident in the period. Each shows its kind (Outage, Alert, Recovery, Maintenance or Certificate) and its state (Ongoing, Acknowledged or Resolved). End time estimated means the monitor didn’t confirm the recovery, so the end time is our best estimate.
To see one monitor in detail, select View All Monitors. See View your monitors.
If something goes wrong
- No Monitors Linked to This Plan is normal for many plans. When we link a monitor to a covered resource, its status and history appear here.
- Monitoring Data Unavailable means we are waiting for fresh readings and won’t show old ones. Check again in a few minutes.
- Monitoring Is Not Included in Your Access means your role can’t see health figures. Ask your account owner.
- Monitoring data could not be loaded. means the tab couldn’t reach its data. Refresh the page.
Fields and statuses
What each item on this page means, what it does and how to read it.
- 7 Days Field
-
What it is. The period the health view covers: 7 Days, 30 Days or 90 Days.
What it does. Choose a period to redraw the figures and charts.
- Availability Metric
-
What it is. The lowest availability among the plan’s resources for the period.
How to read it. A percentage. It is the worst resource, not an average. 99.95% or better is healthy.
- Open Incidents Metric
-
What it is. The number of problems still ongoing.
How to read it. A count. Nothing ongoing right now means 0.
- Incidents in Period Metric
-
What it is. How many incidents started in the period.
How to read it. A count, with how many were outages.
- Monitors Metric
-
What it is. The number of monitors linked to the plan.
How to read it. All reporting means each one sent a recent reading.
- Daily Availability Field
-
What it is. A chart of each monitored resource’s availability per day.
What it does. Choose which resources to chart.
How to read it. Percent per day. Higher is better.
- Availability by Resource Field
-
What it is. One row per resource with its health, availability, downtime, open outages and a strip with one segment per day.
How to read it. Read the strip with the colour key: green, amber, red or grey.
- Plan-Wide Monitors Field
-
What it is. Monitors that watch the plan as a whole.
What it does. They count toward the verdict.
How to read it. They have no daily breakdown yet.
- Incidents Field
-
What it is. Each incident in the period, with its kind and state.
How to read it. End time estimated means the monitor didn’t confirm the recovery.
- 99.95% or Better Status
-
What it is. Availability of 99.95% or better.
How to read it. Green. Healthy.
- 99% to 99.95% Status
-
What it is. Availability from 99% up to 99.95%.
How to read it. Amber. Some downtime.
- Below 99% Status
-
What it is. Availability below 99%.
How to read it. Red. Significant downtime. Ask us about it in a ticket.
- No Data Status
-
What it is. No reading for that day or resource.
How to read it. Grey.
- Outage Option
-
What it is. The resource was down.
- Alert Option
-
What it is. A check passed an alert level.
- Recovery Option
-
What it is. The resource came back after a problem.
- Maintenance Option
-
What it is. Planned work.
- Certificate Option
-
What it is. A certificate problem, such as one close to expiry.
- Ongoing Status
-
What it is. The incident is still going on.
How to read it. Our team is on it.
- Acknowledged Status
-
What it is. Our team has seen the incident and is handling it.
- Resolved Status
-
What it is. The incident is over.
How to read it. Nothing to do.
- Everything We Monitor Is Up Status
-
What it is. Every monitor of the plan sees its resource working.
How to read it. Nothing to do.
- Something We Monitor Is Down Status
-
What it is. At least one monitored resource of the plan isn’t responding.
How to read it. Our team is alerted when something is down. Open a ticket if you need more.