The Service Status page shows whether our services are working right now. It is public, so it opens even when you can’t sign in. Check it first when something seems slow or down.
Open the status page
- Go to the
/statuspage of Lighthouse, for example from a bookmark. - The page refreshes itself about every minute. The time of the last reading is shown at the top, for example Updated 10:05 AM.
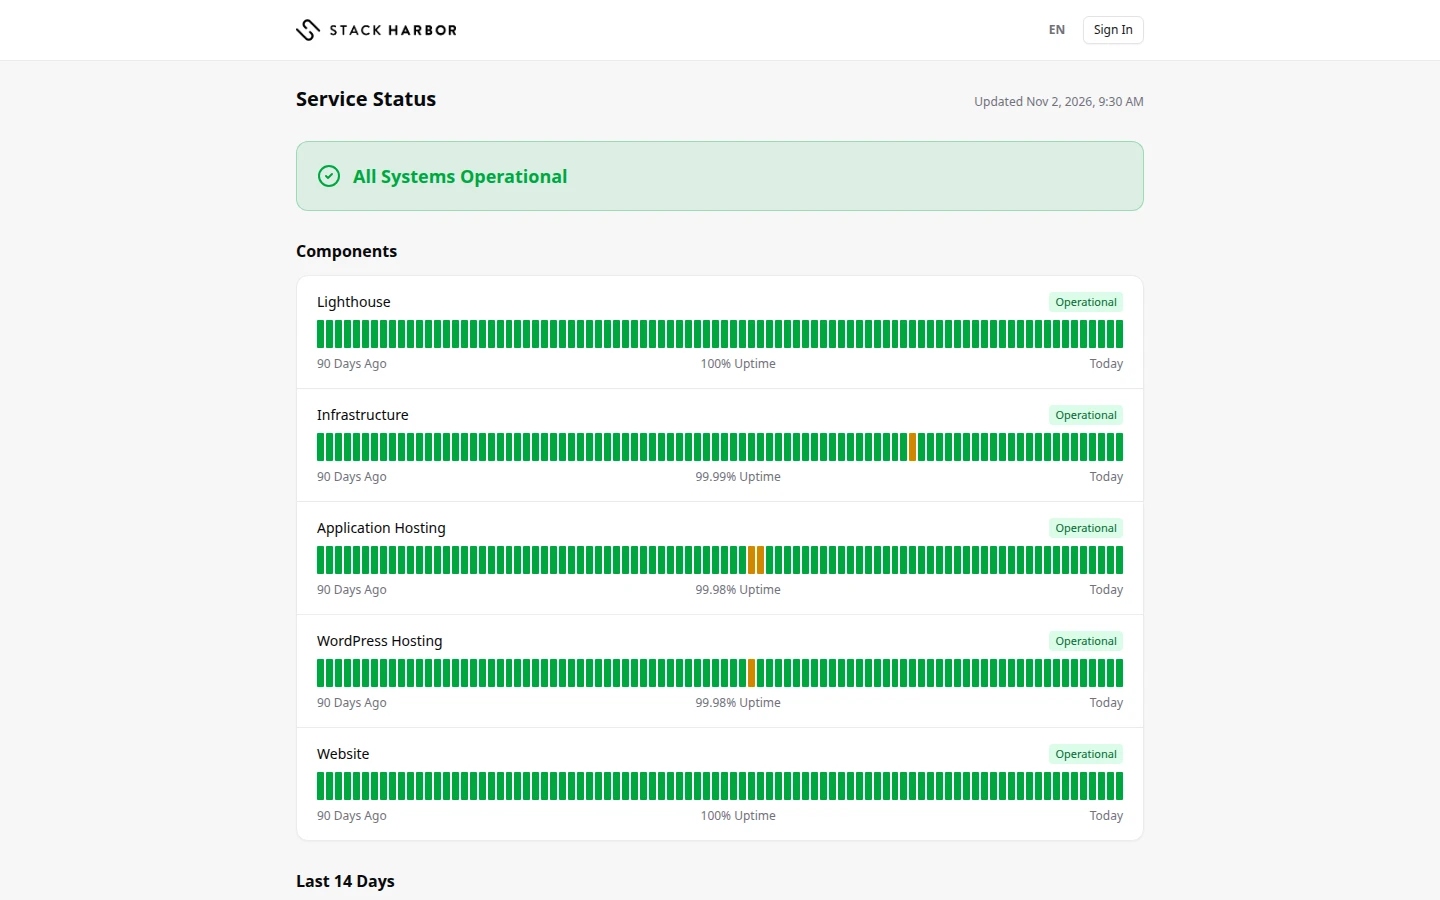
Read the page
- The banner at the top gives the overall state. All Systems Operational means every watched service is working. Partial Outage, Major Outage or Maintenance means at least one service is affected. Status Unknown means we have no reading we can stand behind.
- Scheduled Maintenance lists planned work, with its time window and the services it affects.
- Current Incidents lists problems we are working on. Each shows when it Started and its stage, such as Investigating, Identified, Monitoring or Resolved.
- Components lists each service, such as Lighthouse, Infrastructure, Application Hosting and WordPress Hosting, with its own state. Not Monitored means we don’t watch that service automatically, so the page makes no claim about it.
- Under each component, a bar shows the last 90 days, one segment per day. Hold the pointer over a segment to see that day’s uptime. A green segment means 100% uptime that day. An amber segment means at least 95%, and a red segment means less than 95%. A grey segment means No Data.
- Last 14 Days lists the incidents of the past two weeks. No incidents in the last 14 days. means there were none.
What to do next
If the page shows a problem with a service you use, you don’t need to open a ticket about it. Our team already knows. If your problem isn’t on the page, open a support ticket.
Select Back to Lighthouse to return to the portal, or Sign In if you aren’t signed in.
If something goes wrong
- Status Can’t Be Loaded means the page couldn’t read the current status. It doesn’t mean our services are down. Select Try Again.
- We couldn’t refresh this. It shows the last status we read. means the latest refresh failed, so the page still shows the previous reading.
Fields and statuses
What each item on this page means, what it does and how to read it.
- All Systems Operational Status
-
What it is. Every service we watch is working.
How to read it. The banner at the top of the page.
- Partial Outage Status
-
What it is. At least one service is partly down or slow.
What it does. Check the Components list to see which one.
How to read it. The banner at the top of the page.
- Major Outage Status
-
What it is. At least one service is down.
What it does. Our team is working on it. Follow Current Incidents for updates.
How to read it. The banner at the top of the page.
- Maintenance Status
-
What it is. Planned work is in progress.
What it does. See Scheduled Maintenance for the window.
How to read it. The banner at the top of the page.
- Status Unknown Status
-
What it is. We have no reading we can stand behind right now.
What it does. It does not mean services are down. Check again soon.
How to read it. The banner at the top of the page.
- Operational Status
-
What it is. The service is working normally.
How to read it. Shown next to each component.
- Partial Outage Status
-
What it is. Part of the service is down or slow.
How to read it. Shown next to each component.
- Major Outage Status
-
What it is. The service is down.
How to read it. Shown next to each component.
- Maintenance Status
-
What it is. The service is in planned maintenance.
How to read it. Shown next to each component.
- Not Monitored Status
-
What it is. We don’t watch this service automatically, so the page makes no claim about it.
How to read it. Shown next to each component.
- Investigating Status
-
What it is. We know about a problem and are looking for the cause.
How to read it. The stage of an incident.
- Identified Status
-
What it is. We found the cause and are fixing it.
How to read it. The stage of an incident.
- Monitoring Status
-
What it is. A fix is in place, and we are watching that it holds.
How to read it. The stage of an incident.
- Resolved Status
-
What it is. The incident is over.
How to read it. The stage of an incident.
- {pct} Uptime Metric
-
What it is. The share of a day a component was up, as a percentage. Each component has 90 daily segments.
How to read it. Green is 100%, amber is at least 95%, red is below 95%. Hold the pointer over a segment to see its figure.
- No Data Status
-
What it is. No figure exists for that day, or the component isn’t watched.
How to read it. A grey segment. It is never counted as 100%.
- Scheduled Maintenance Field
-
What it is. Planned work, with its time window and the services it affects.
- Current Incidents Field
-
What it is. Problems we are working on now, with when each started and its stage.
- Last 14 Days Field
-
What it is. Incidents from the past two weeks.