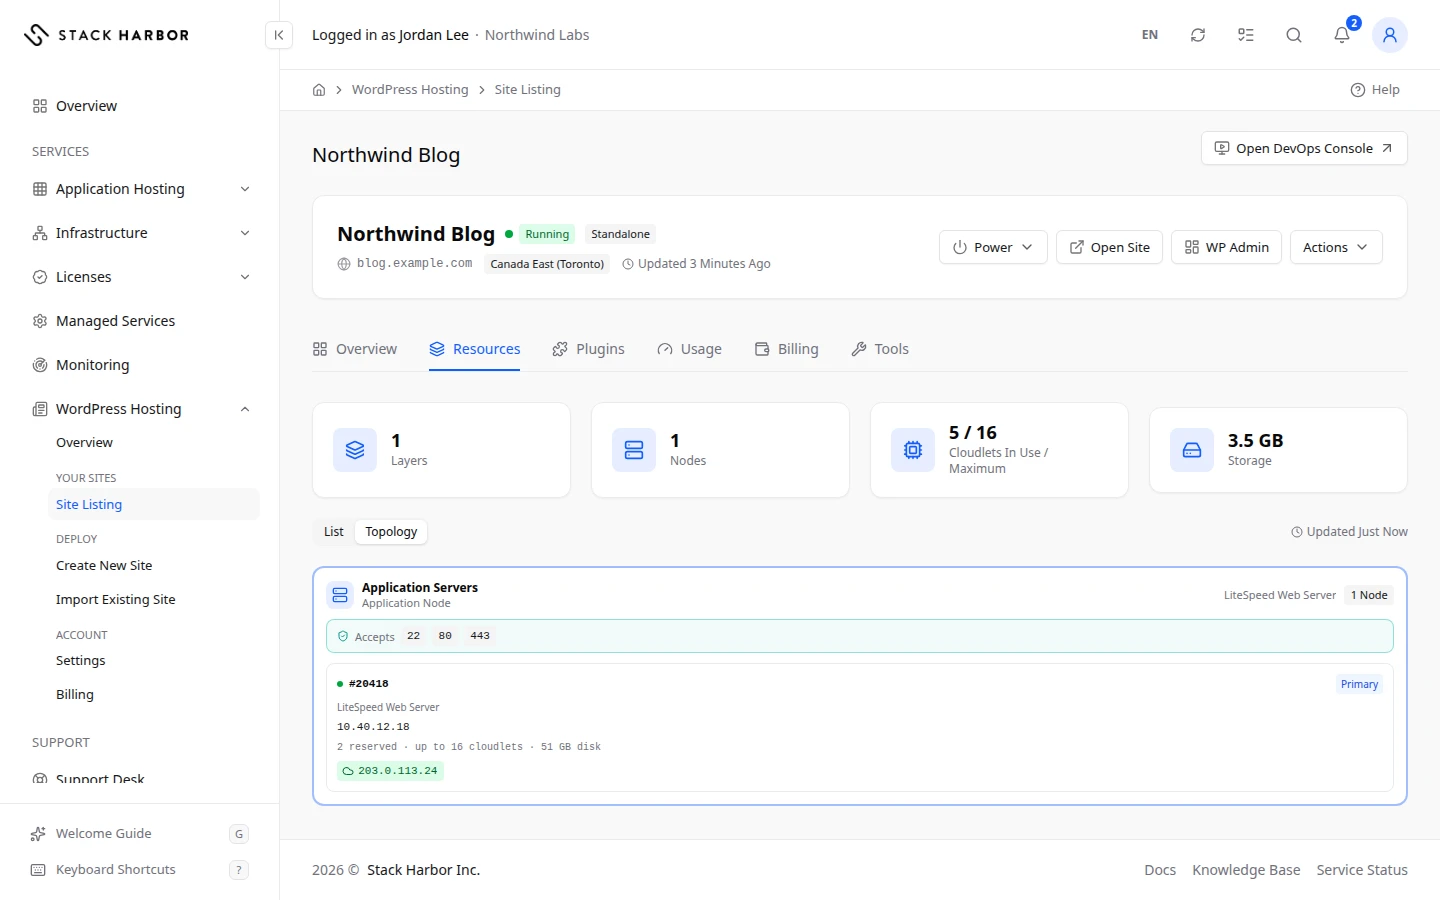
A WordPress site runs on one or more nodes. A node is one server, and a layer is a group of nodes that do the same job, such as the Application Nodes that run PHP or the database. The Resources and Usage tabs on a site’s page show them.
See the site’s nodes
- Open the site from Site Listing, then select the Resources tab.
- Choose a view:
- List shows each layer with its nodes, their size and their state.
- Topology draws the layers as a diagram, from the load balancer down to the database and storage.
- Select a layer or a node to open its own page. It keeps the site’s header and tabs, with Resources selected.
Browse the site’s files
In the List view or on a node’s page, select Browse Files to open Files. It shows the application and configuration files on that node. The site must be running.
Read the site’s usage
- Select the Usage tab.
- Current Environment Totals shows what the site uses right now, over the last few minutes.
- The charts below show how usage changed over time. Open a layer or a node to see its own usage.
If you see Not Enough Usage Data Yet, the site is new or was stopped. Come back later.
A multi-region site
A multi-region site has one set of nodes in each region. On Resources and Usage, a Region selector appears above the view. The primary region comes first. Choose a region to see its nodes and usage.
These views work the same way as for an Application Hosting environment, including resizing a layer. See Manage an environment.