The Performance tab charts every figure we can read for a monitor. Use it to find when a problem started and what changed.
Open the charts
- Open the monitor from Monitoring.
- Select the Performance tab.
- Choose the time window at the top. See View a monitor for the presets and zoom.
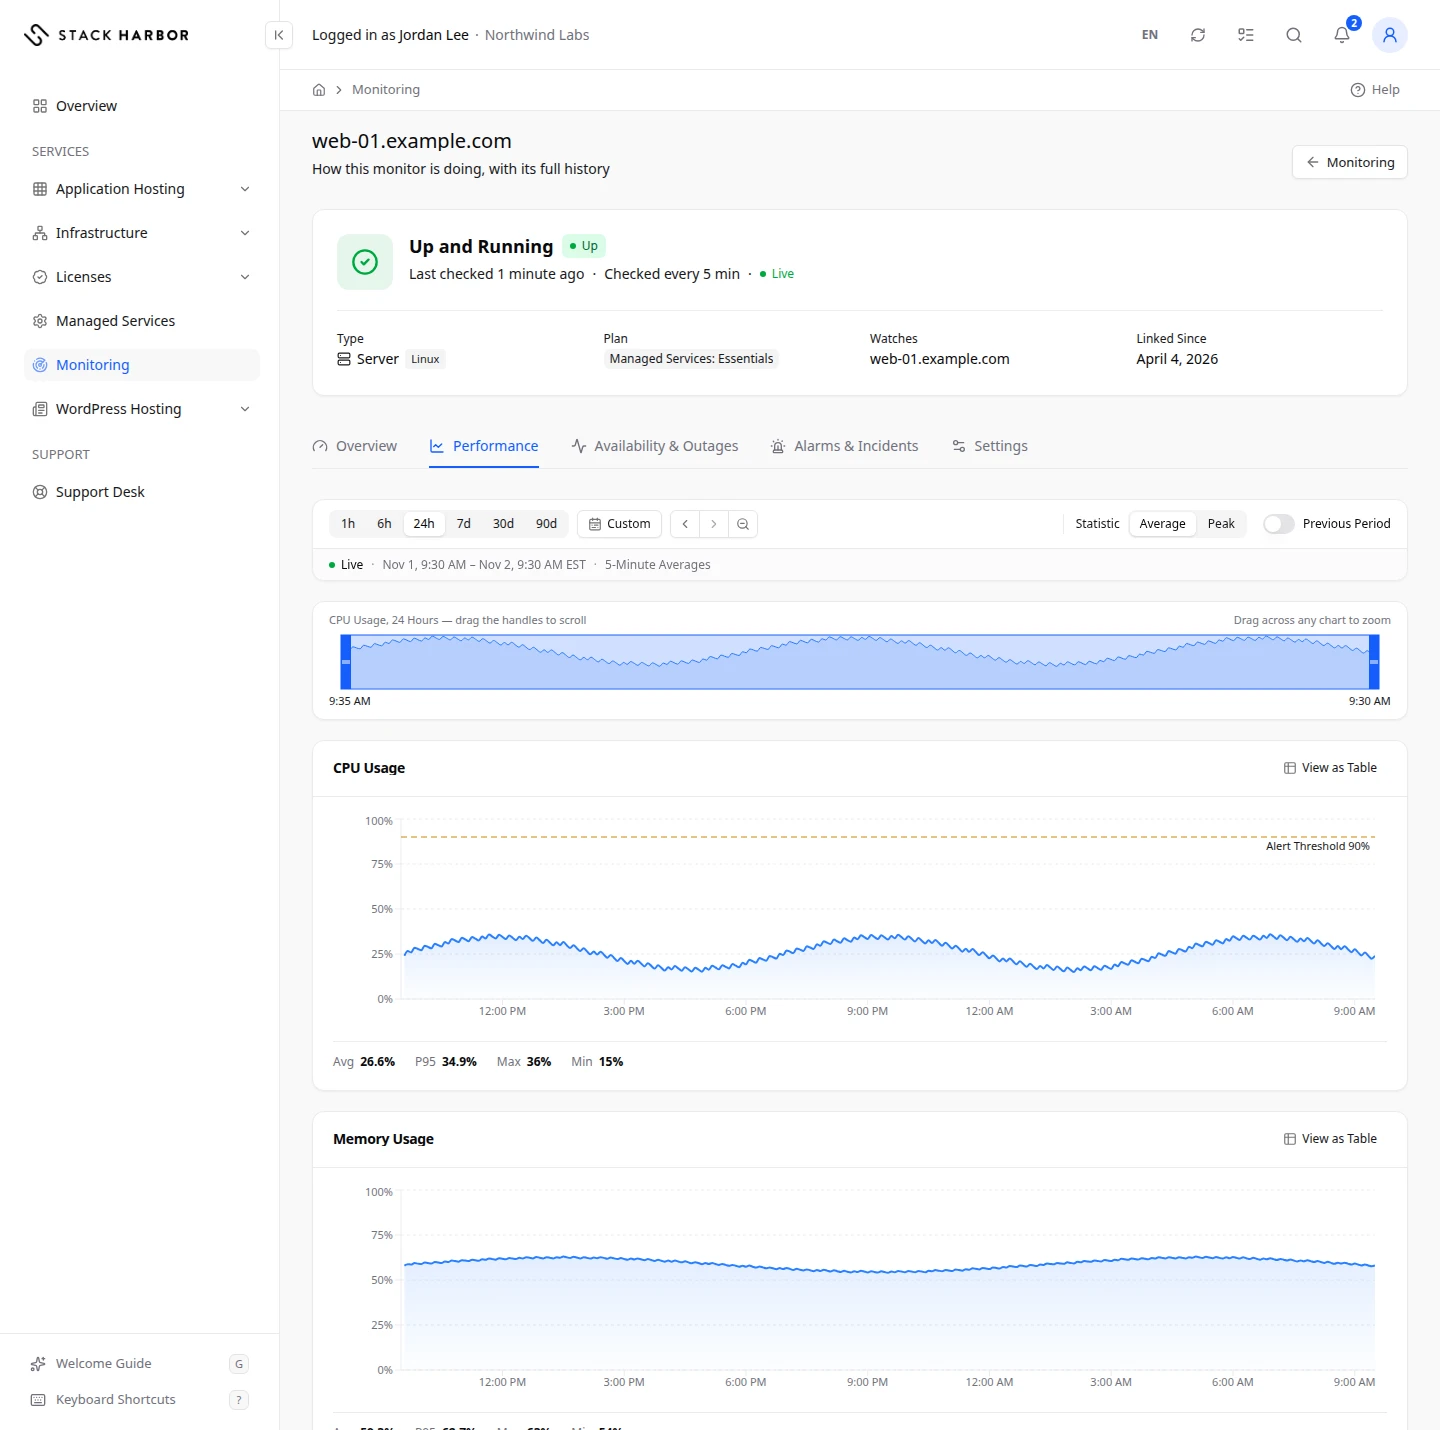
Choose how values are summed up
- Statistic sets how each point of a chart is calculated. Average is the mean value for that slice of time. P95 shows the value 95% of readings stayed under. Peak is the highest value. P95 appears only for monitors that answer requests.
- Previous Period draws the same length of time just before the window as a second line, so you can compare. Charts that can’t compare say No Comparison for This Chart.
- The label above each chart says how points are grouped, for example 5-Minute Averages or Hourly Peaks.
The strip under the toolbar shows the main figure across a longer base window. Drag its handles to move the window. Hover over any chart to see the same moment on all of them, and drag across a chart to zoom.
The sections
Each monitor shows only the sections it can measure.
- Response Time charts how long the resource took to answer, in milliseconds. Response Time by Location splits it by checking place. Response Time Breakdown splits each answer into DNS Lookup, Connection, TLS Handshake, First Byte and Download. Lower is better. Watch for jumps above your usual level.
- Packet Loss charts the share of test packets lost, in percent. A healthy reading is 0%.
- CPU charts CPU Usage in percent, with Usage per Core, CPU Time Breakdown and Interrupts and Context Switches. Steady use near 100% means the server has no spare capacity.
- Memory charts Memory Usage and Swap Usage in percent or bytes. Regular swap use means the server is short of memory.
- Load charts Load Average, the number of processes waiting for the processor. Compare it with the number of CPU cores. A load above the core count means work is queuing.
- Disk charts Disk Usage and Usage by Partition in percent, Disk Throughput for reads and writes in bytes per second, and Disk Busy in percent. Choose one partition or All Partitions.
- Disk Fill Forecast estimates the number of days until a partition reaches a fill level, from recent growth. Used Now is today’s fill. Not Growing means usage is flat or falling, and Reached means the level is already passed. A forecast is an estimate, not a promise.
- Processes charts Blocked Processes, the processes waiting on the disk or network.
- Patterns shows Busy Hours, the average CPU by hour of day, and Monthly Trend, the monthly availability, outages and alarms.
A line under the charts names anything we can’t read in Lighthouse yet, such as network traffic per interface.
If something goes wrong
- Some charts in this section couldn’t be read for this window. means part of the data is missing. Try a different window.
- Not enough data yet. means the monitor hasn’t collected enough history.
- If the tab says there is no history before a date, the monitor was linked that day.
Fields and statuses
What each item on this page means, what it does and how to read it.
- Statistic Option
-
What it is. How each point of a chart is calculated.
What it does. Choose Average, P95 or Peak.
How to read it. Average is the mean, P95 is the value 95% of readings stayed under, Peak is the highest. P95 appears only for monitors that answer requests.
- Previous Period Option
-
What it is. Draws the same length of time just before the window as a second line.
What it does. Use it to compare with before.
How to read it. Charts that can’t compare say No Comparison for This Chart.
- Response Time Metric
-
What it is. How long the resource took to answer.
How to read it. Milliseconds. Lower is better. Watch for jumps above your usual level.
- Response Time Breakdown Metric
-
What it is. Each answer split into DNS Lookup, Connection, TLS Handshake, First Byte and Download.
How to read it. Milliseconds per step. The biggest part shows where time is lost.
- Packet Loss Metric
-
What it is. The share of test packets lost.
How to read it. Percent. 0% is healthy.
- CPU Usage Metric
-
What it is. How busy the server’s processor is.
How to read it. Percent. Steady use near 100% means no spare capacity.
- Memory Usage Metric
-
What it is. How much of the server’s memory is in use.
How to read it. Percent or bytes. Close to 100% means the server is short of memory.
- Swap Usage Metric
-
What it is. How much disk space the server uses as extra memory.
How to read it. Percent or bytes. Regular swap use means the server is short of memory.
- Load Average Metric
-
What it is. The number of processes waiting for the processor.
How to read it. A number. Compare it with the number of CPU cores: above the core count, work is queuing.
- Disk Usage Metric
-
What it is. How full the server’s disks are.
How to read it. Percent. Plan for more space well before 100%.
- Disk Throughput Metric
-
What it is. How much data the server reads from and writes to disk.
How to read it. Bytes per second.
- Disk Busy Metric
-
What it is. The share of time the disk is busy.
How to read it. Percent. Steady use near 100% means the disk slows the server down.
- Disk Fill Forecast Metric
-
What it is. An estimate of the days until a partition reaches a fill level, from recent growth.
How to read it. Days. Not Growing means usage is flat or falling. Reached means the level is already passed. It is an estimate.
- Blocked Processes Metric
-
What it is. Processes waiting on the disk or network.
How to read it. A count. Healthy is near 0.
- Busy Hours Field
-
What it is. The average CPU use by hour of day.
How to read it. Darker hours are busier.
- Monthly Trend Field
-
What it is. The monthly availability, outages and alarms.
How to read it. One row per month.