Application Hosting is billed for what your environments use. Lighthouse shows that in three places. Usage on an environment shows its resource use. Billing on an environment shows its cost this month. Application Hosting Usage shows the cost of every environment on the account.
See what an environment uses
- Open the environment, then select Usage.
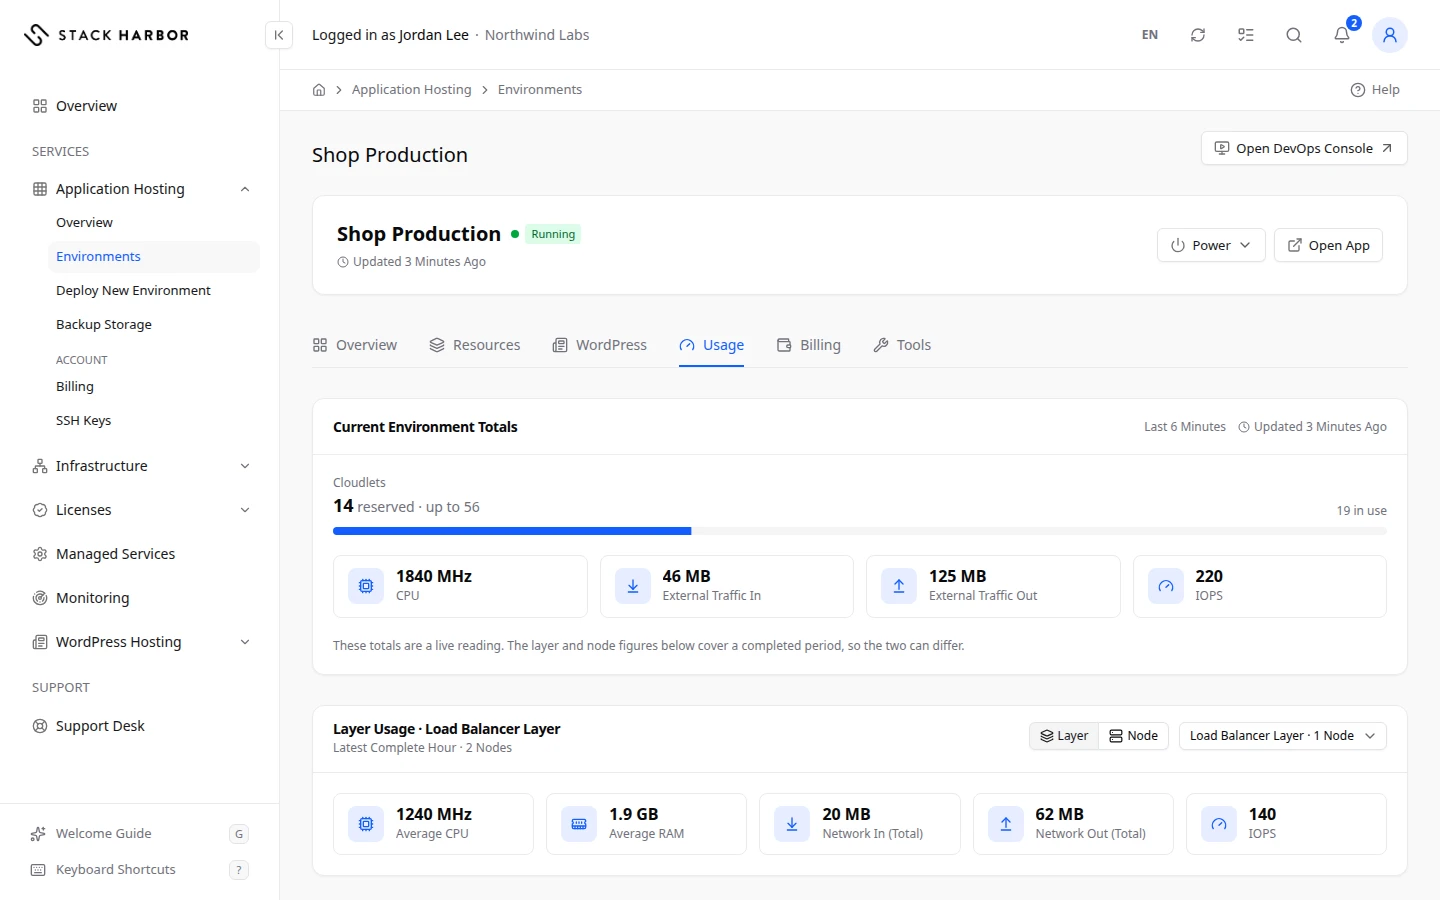
- Current Environment Totals is a live reading over the last few minutes. It shows Cloudlets in use against the reserved and maximum, CPU in MHz, External Traffic In, External Traffic Out and IOPS (disk reads and writes per second).
- Below, choose Layer or Node, then pick which one. Its figures cover the latest complete period: Average CPU, Average RAM, Network In (Total) and Network Out (Total).
- The usage trend chart plots CPU in MHz and RAM in MB. Pick 24h, 7d or 30d for the time range.
A healthy layer stays below its maximum cloudlets most of the time. If CPU or cloudlets sit at the maximum for long periods, the layer needs more room. See Scale layers and nodes.
The live totals and the layer figures cover different periods, so the two can differ.
See an environment’s cost this month
- Open the environment, then select Billing.
- Cost This Period shows the estimated cost for the current month, split by Resource: Cloudlets, Storage, Network, Public IPs, SSL and Licenses. The Total is at the bottom.
- Select View Full Usage to open the account-wide report.
This is an estimate for this environment. The charge appears on your invoice.
Read the account-wide report
- Open Application Hosting, then Billing. The Application Hosting Usage page opens.
- Pick the month in Billing Month, or use Previous Month and Next Month. Billing months run on UTC time.
- To see a span of days, select Custom Range and set From and To, or choose a Quick Picks option such as Last 30 Days.
- Read the totals.
- Total This Period is the month so far. Total for These Billing Months sums whole months.
- Usage in This Range covers a custom range. It’s usage before tax, not an invoice.
- Cost by Resource splits the total across cloudlets, storage, network, public IPs, SSL and licenses, with each one’s share of the total.
- Cost Details lists each Environment with its cost per resource and its Subtotal. Use Group By to switch between Environment and Resource.
An environment deleted during the month keeps its usage in the report, marked Deleted. WordPress Hosting sites are billed under WordPress Hosting, on their own report. See Read WordPress Hosting usage.
If something goes wrong
- Not Enough Usage Data Yet means the environment hasn’t run long enough. Check back later.
- Billing Data Is Temporarily Unavailable means the report couldn’t load. Try again shortly.
- No Usage This Period means nothing has been billed yet this month.
- License costs could not be read right now, so the license figure and the total may be lower than your bill. Try again in a few minutes.
Fields and statuses
What each item on this page means, what it does and how to read it.
- Cloudlets Metric
-
What it is. The cloudlets in use now, with the reserved and maximum figures.
How to read it. One cloudlet is 128 MiB of memory and 200 MHz of CPU. Healthy when it stays below the maximum.
- CPU Metric
-
What it is. The processor power in use, in MHz.
How to read it. Long stretches near the maximum mean the layer needs more cloudlets.
- External Traffic In Metric
-
What it is. Data arriving from the internet over the last few minutes.
- External Traffic Out Metric
-
What it is. Data sent to the internet over the last few minutes.
How to read it. Outbound traffic can be billed. See Billing.
- IOPS Metric
-
What it is. Disk reads and writes per second.
- Average CPU Metric
-
What it is. The average processor use of the layer or node over the latest complete period, in MHz.
- Average RAM Metric
-
What it is. The average memory use of the layer or node over the latest complete period.
- Network In (Total) Metric
-
What it is. All data received by the layer or node over the latest complete period.
- Network Out (Total) Metric
-
What it is. All data sent by the layer or node over the latest complete period.
- Awaiting Samples Status
-
What it is. No reading has come in yet for this figure.
How to read it. Wait a few minutes. New environments need a little time before figures appear.
- Cost This Period Metric
-
What it is. The estimated cost of this environment for the current month, by resource.
How to read it. Post-billed: it appears on your invoice after the month ends.
- Cloudlets Column
-
What it is. The cost of the cloudlets the environment reserved and used.
How to read it. Usually the largest part of the bill.
- Storage Column
-
What it is. The cost of disk space.
- Network Column
-
What it is. The cost of traffic.
- Public IPs Column
-
What it is. The cost of public IP addresses.
- SSL Column
-
What it is. The cost of SSL.
- Licenses Column
-
What it is. The cost of software licences, such as LiteSpeed.
How to read it. Licence hours count the hours a licence was in use.
- Total This Period Metric
-
What it is. The usage cost of all your environments for the billing month so far.
How to read it. Before tax. Billing months run on UTC time. Post-billed after the month ends.
- Usage in This Range Metric
-
What it is. The usage that built up over a custom range of days.
How to read it. Before tax and not an invoice. Figures are rounded per line, so they can differ from the month by a cent per line.
- Cost by Resource Metric
-
What it is. The total split across cloudlets, storage, network, public IPs, SSL and licences.
How to read it. Each line shows its share of the total.
- Environment Column
-
What it is. An environment that had usage in the period.
How to read it. Deleted marks one removed during the month, which keeps its usage.
- Subtotal Column
-
What it is. The total cost of one environment for the period.
- Billing Month Field
-
What it is. The month the report shows.
What it does. Changes every figure on the page. Previous Month and Next Month step through months.
How to read it. Billing months run on UTC time.
- Custom Range Field
-
What it is. A span of whole days to report on, instead of a month.
What it does. Shows Usage in This Range for the days you choose.
How to read it. Billing days run on UTC time.
- Group By Field
-
What it is. How the cost table is cut.
What it does. Environment lists one row per environment. Resource lists one row per kind of resource.
- Deleted Status
-
What it is. The environment was deleted during this period.
What it does. Its usage up to the deletion stays in the report and on the invoice.